AddToInstrumentHistory
Description
It is used to add a new item to the History view of the instrument. Currently, only adding chart items or widgets (Tabulator, Plotly or LineChart) are supported.
For example in the Rigol Waveform Data example we have this Action:
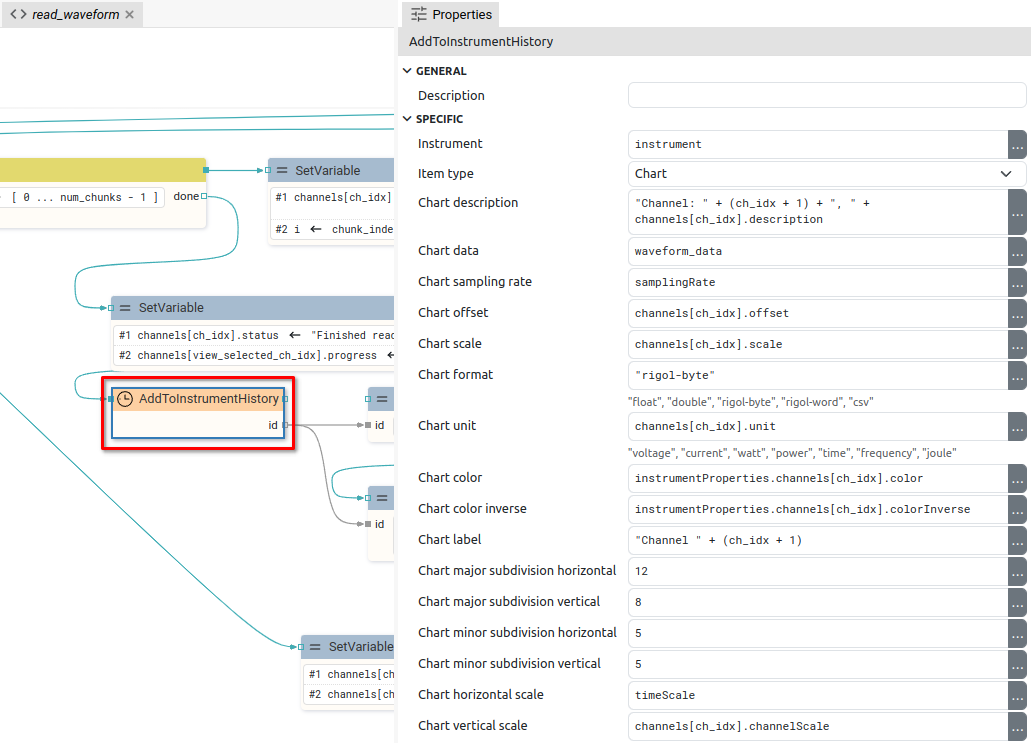
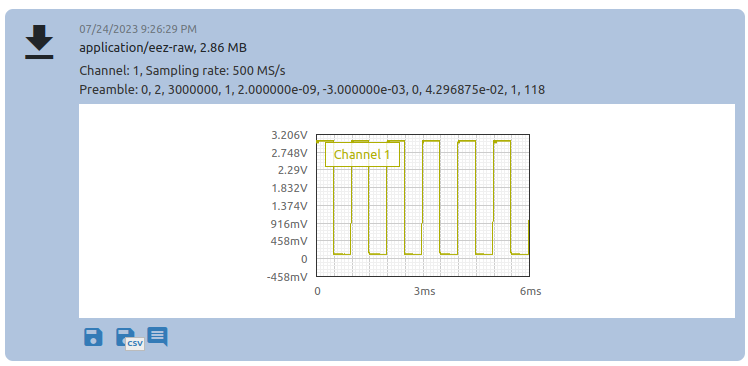
It is used to add a chart which, after successful addition, will be displayed as follows (example of test signal acquisition):
Properties
Specific
-
Instrument
EXPRESSION (object:Instrument)
-
An instrument in whose History an item will be added.
-
Item type
Enum
-
Item type to be added. It can be
"Chart"or"Widget". -
Chart description
EXPRESSION (string)
-
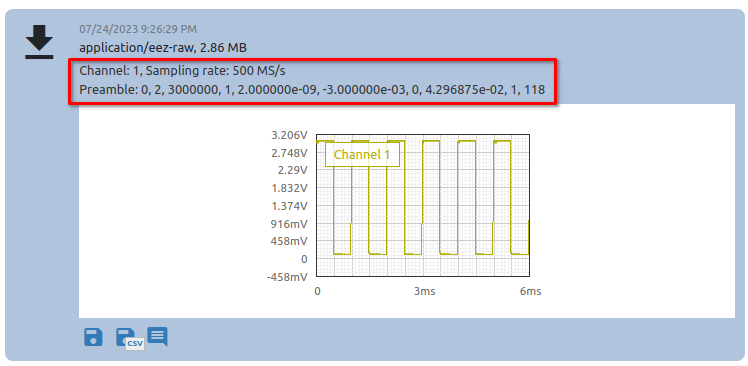
Description of the chart displayed in the instrument History:
This property is only available when
Item typeisChart. -
Chart data
EXPRESSION (blob)
-
A string or blob containing the samples that will be displayed in the chart.
This property is only available when
Item typeisChart. -
Chart sampling rate
EXPRESSION (float)
-
Sampling rate or number of samples per second (SPS).
This property is only available when
Item typeisChart. -
Chart offset
EXPRESSION (double)
-
Offset value used in formula
offset + sample_value * scalewhich transforms sample value to sample position on y axis in the chart.This property is only available when
Item typeisChart. -
Chart scale
EXPRESSION (double)
-
When displaying samples, the formula
offset + sample_value * scaleis used.This property is only available when
Item typeisChart. -
Chart format
EXPRESSION (string)
-
Format from
Chart data. Possible values:"float"– “Chart data” must be a blob containing 32-bit, little-endian float numbers."double"– “Chart data” must be a blob containing 64-bit, little-endian float numbers."rigol-byte"– “Chart data” must be a blob containing 8-bit unsigned integer numbers."rigol-word"– “Chart data” must be a blob containing 16-bit unsigned integer numbers."csv"– “Chart data” must be a CSV string, the first column is taken.
This property is only available when
Item typeisChart. -
Chart unit
EXPRESSION (integer)
-
The unit displayed on the Y-axis. The X-axis is always time.
This property is only available when
Item typeisChart. -
Chart color
EXPRESSION (string)
-
The color of the line in the chart if a dark background is selected.
This property is only available when
Item typeisChart. -
Chart color inverse
EXPRESSION (string)
-
The color of the line in the chart if the light background is selected.
This property is only available when
Item typeisChart. -
Chart label
EXPRESSION (string)
-
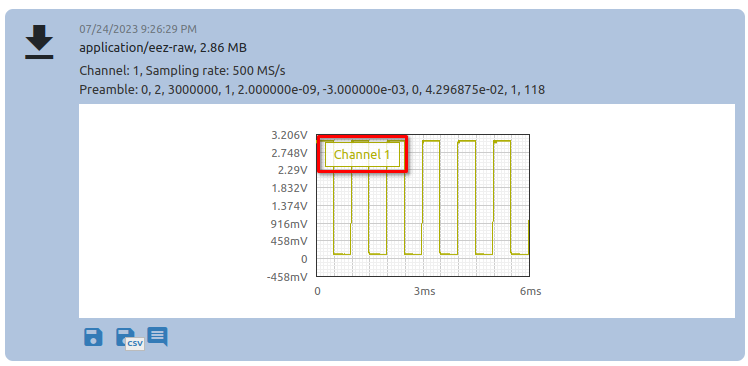
Chart label:
This property is only available when
Item typeisChart. -
Chart major subdivision horizontal
EXPRESSION (integer)
-
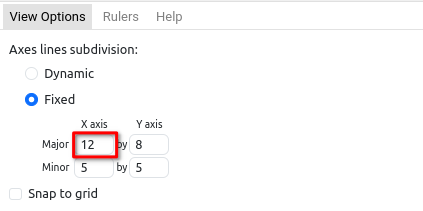
This property is only available when
Item typeisChart. -
Chart major subdivision vertical
EXPRESSION (integer)
-
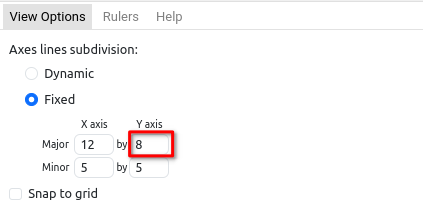
This property is only available when
Item typeisChart. -
Chart minor subdivision horizontal
EXPRESSION (integer)
-
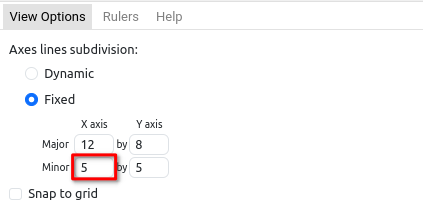
This property is only available when
Item typeisChart. -
Chart minor subdivision vertical
EXPRESSION (integer)
-
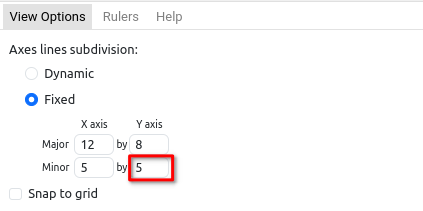
This property is only available when
Item typeisChart. -
Chart horizontal scale
EXPRESSION (double)
-
The number that defines the X-axis zoom factor in the default chart view.
This property is only available when
Item typeisChart. -
Chart vertical scale
EXPRESSION (double)
-
The number that defines the Y-axis zoom factor in the default chart view.
This property is only available when
Item typeisChart. -
Widget
EXPRESSION (widget)
-
Reference to the Tabulator, Plotly or LineChart widget. See
Output widget handleproperty to find out how to obtain this reference.This property is only available when
Item typeisWidget.
General
-
Description
String
-
This is the description of the Action component. Description is displayed below the component in the Project editor/viewer. In the main toolbar, it is possible to hide or display descriptions of all components with one click.
Flow
-
Inputs
Array
-
Additional component inputs that the user can add as desired in order to use them to receive additional data needed when evaluating expressions in properties. Each input is given a name and type. Name is used when referencing an input within an expression. A type is used to project Check to check whether a data line that transmits data of that type is connected to the input or not.
-
Outputs
Array
-
Additional component outputs that the user can add to send data through. Each output is assigned a name and type. An example of using this output is e.g. in the Loop component, where we can put the output name for the
Variableproperty instead of e.g. variable name. In that case, the Loop component will not change the content of the variable in each step, but will send the current value through that output. -
Catch error
Boolean
-
If this checkbox is enabled then an
@Erroroutput will be added to the component and if an error occurs in this component during the execution of the Flow, the Flow will continue through that output. The data that will be passed through that output is the textual description of the error.
Position and size
-
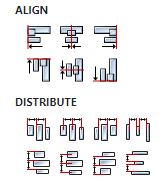
Align and distribute
Any
-
Alignment icons and component distribution. Alignment icons appear when two or more components are selected, and distribution icons appear when three or more components are selected.
Inputs
-
seqin
SEQ | MANDATORY
-
A standard sequence input.
Outputs
-
seqout
SEQ | OPTIONAL
-
A standard sequence output.
-
id
DATA(string) | OPTIONAL
-
ID of the added history item. We can, for example, use this data in the
ChartWidget to display the chart history item inside the dashboard.
Examples
- Rigol Waveform Data