I2. Instrument activity bar
When we open the instrument in its view, an Activity bar will be displayed along the left edge. The number of options in the activity bar is defined by IEXT and may vary for different instruments.
I2.1. Start page (EEZ BB3 only)
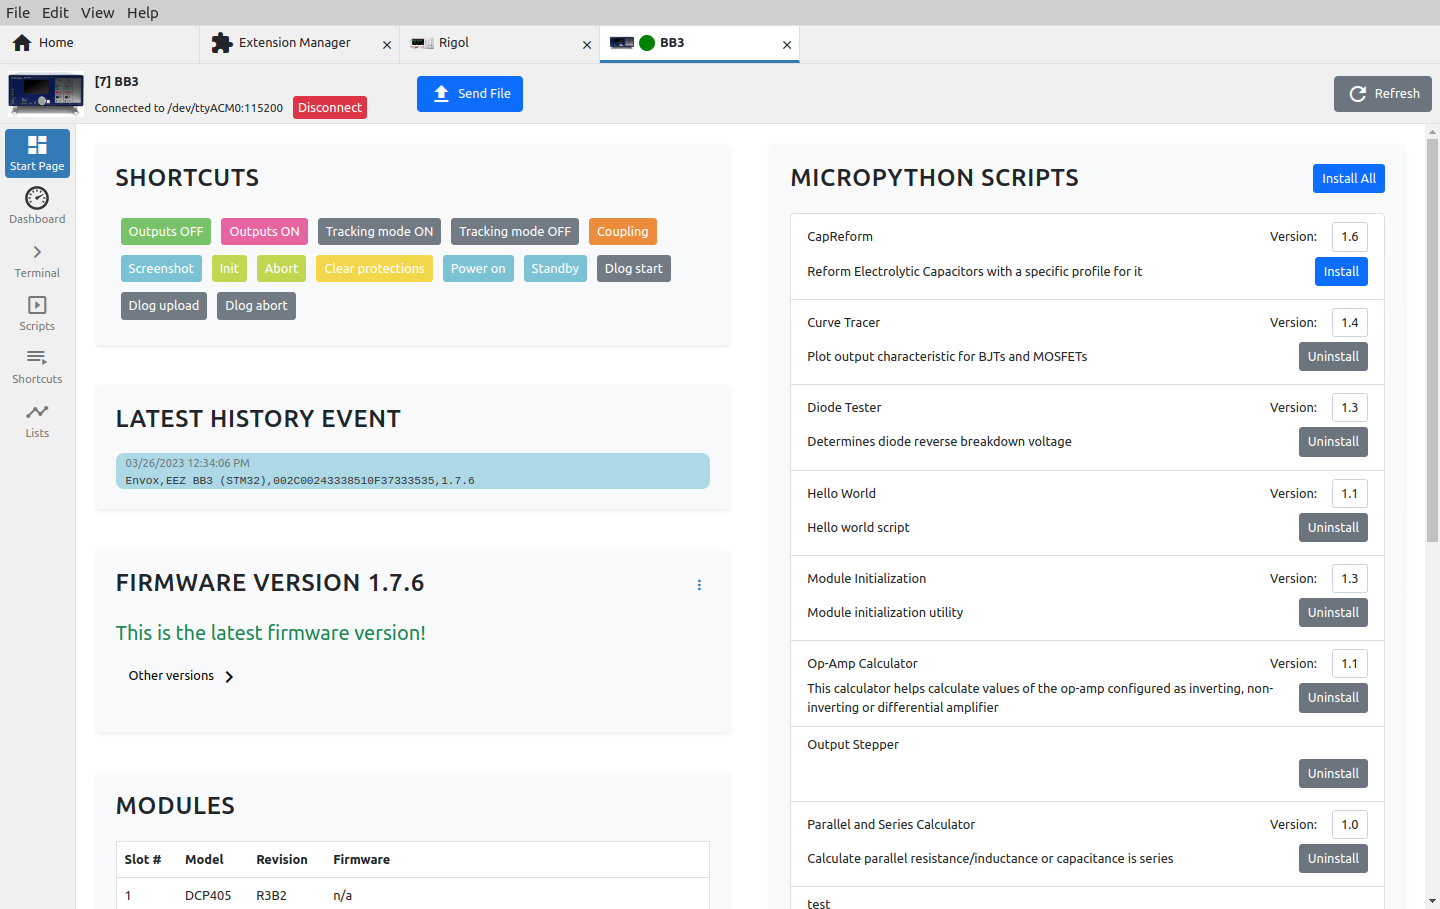
Fig. 1: EEZ BB3 start page
|
Section / option |
Description |
|
Send file |
Opens a dialog for sending the file to EEZ BB3. To send, it is necessary to choose the source file, the desired name of the destination file. The destination folder path can be chosen from the offered list or set a new one. The parameters of the send file protocol are predefined and can be viewed and changed via the “gear” button in the lower left corner. |
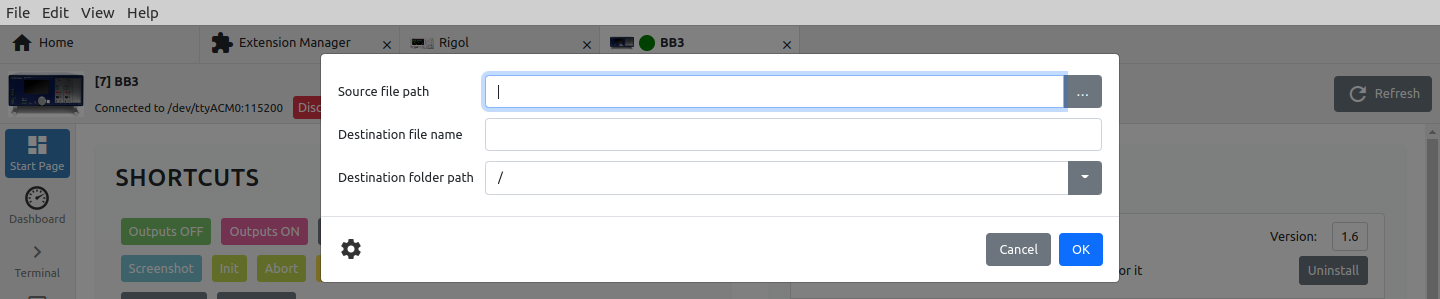 Fig. 2: Sending a file to EEZ BB3
|
|
|
Refresh |
Refresh all data displayed on the Start page. |
|
Shortcuts |
List of available shortcuts from which they can be executed directly. |
|
Latest history event |
Shows the last result of interaction with the instrument via the Terminal tab. |
|
Firmware version |
Displays information about the installed firmware version. If a newer version than the currently installed one is published, an upgrade option will be offered. It is also possible to manually install another version of the firmware (1) or downgrade the version from the offered list (2) as shown in Fig. 3. |
|
|
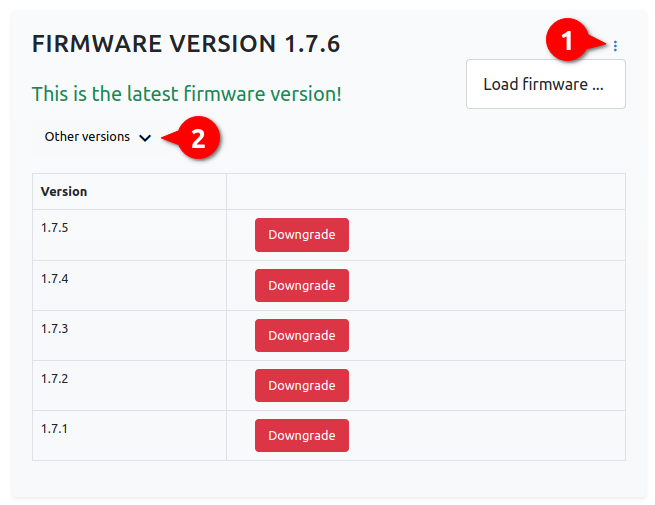 Fig. 3: EEZ BB3 firmware version section
|
|
Modules |
Display of installed modules. If the module has firmware, information will be displayed as to whether it is up-to-date or not and the possibility to upgrade or install another version. Upload Pinout Pages is used to update pinout images of all modules. |
|
|
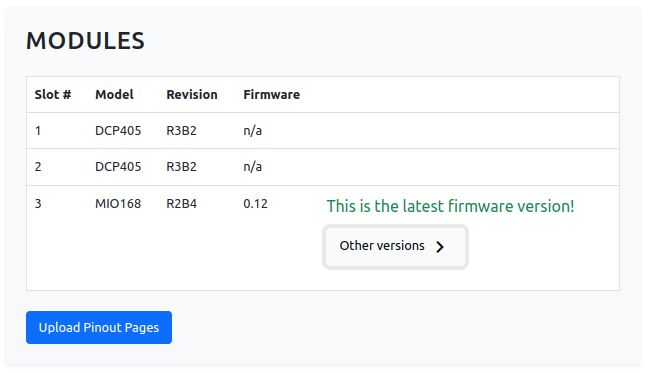 Fig. 4: EEZ BB3 modules section
|
|
Micropython scripts |
List of all Micropython scripts that are on EEZ BB3. For scripts that are synchronized with the GitHub repository, their versions and options to install or uninstall will be displayed. For scripts created by the user, versions will not be displayed, only the option to install or uninstall. |
|
Lists |
Program lists created by the user (see Section 2.5.). and which are located on EEZ BB3. Lists can be downloaded, uploaded and edited.
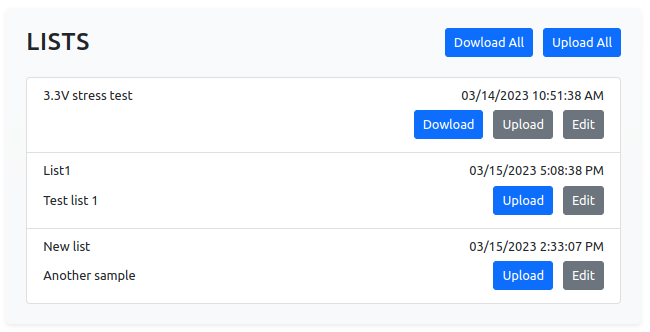 Fig. 5: EEZ BB3 program lists
|
I2.2. Dashboard
Fig. 6 shows an example Dashboard that enables simple operations with EEZ BB3 modules.
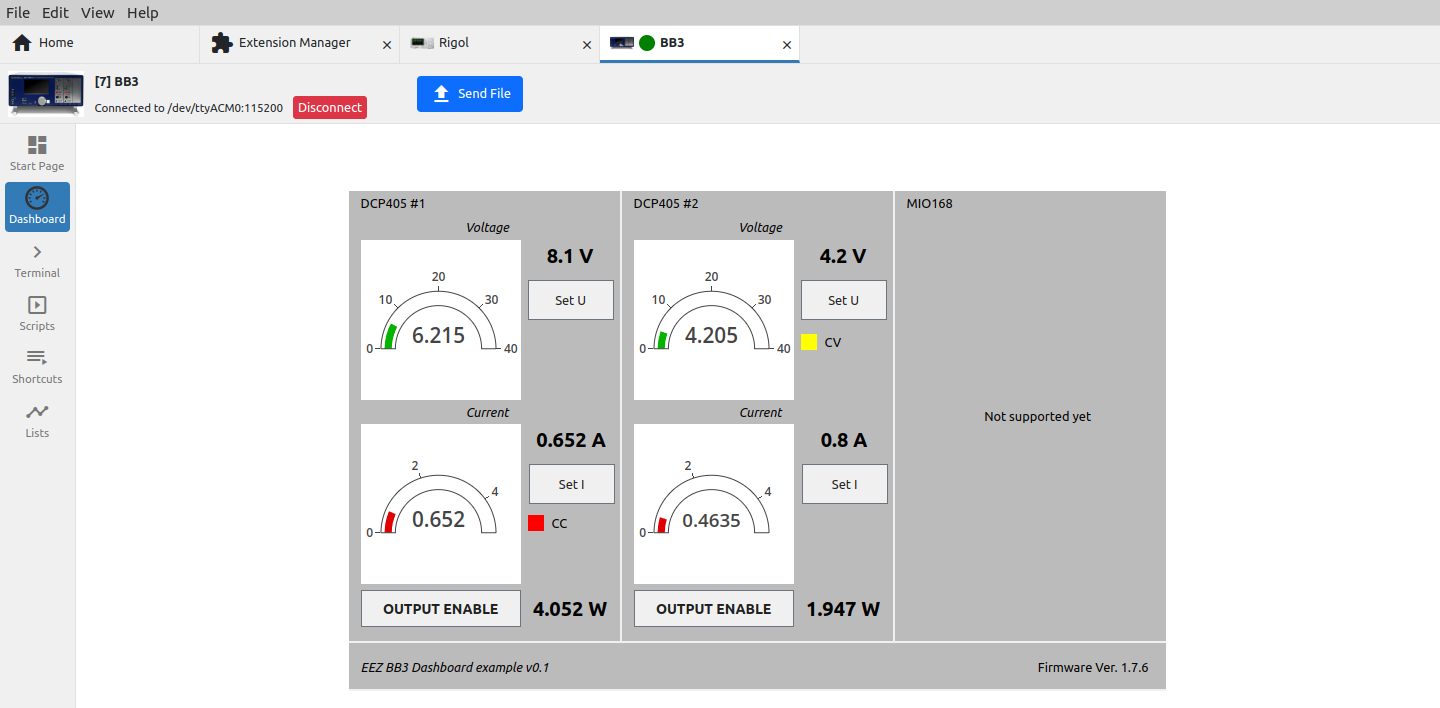
Fig. 6: Instrument dashboard example
I2.3. Terminal (SCPI protocol)
The terminal allows interaction with the instrument, which is primarily based on the SCPI specification.
The number of SCPI commands varies greatly between instruments, and IEXT can also include help for easier finding of the desired SCPI command or query that will be displayed at the bottom of the screen (7).
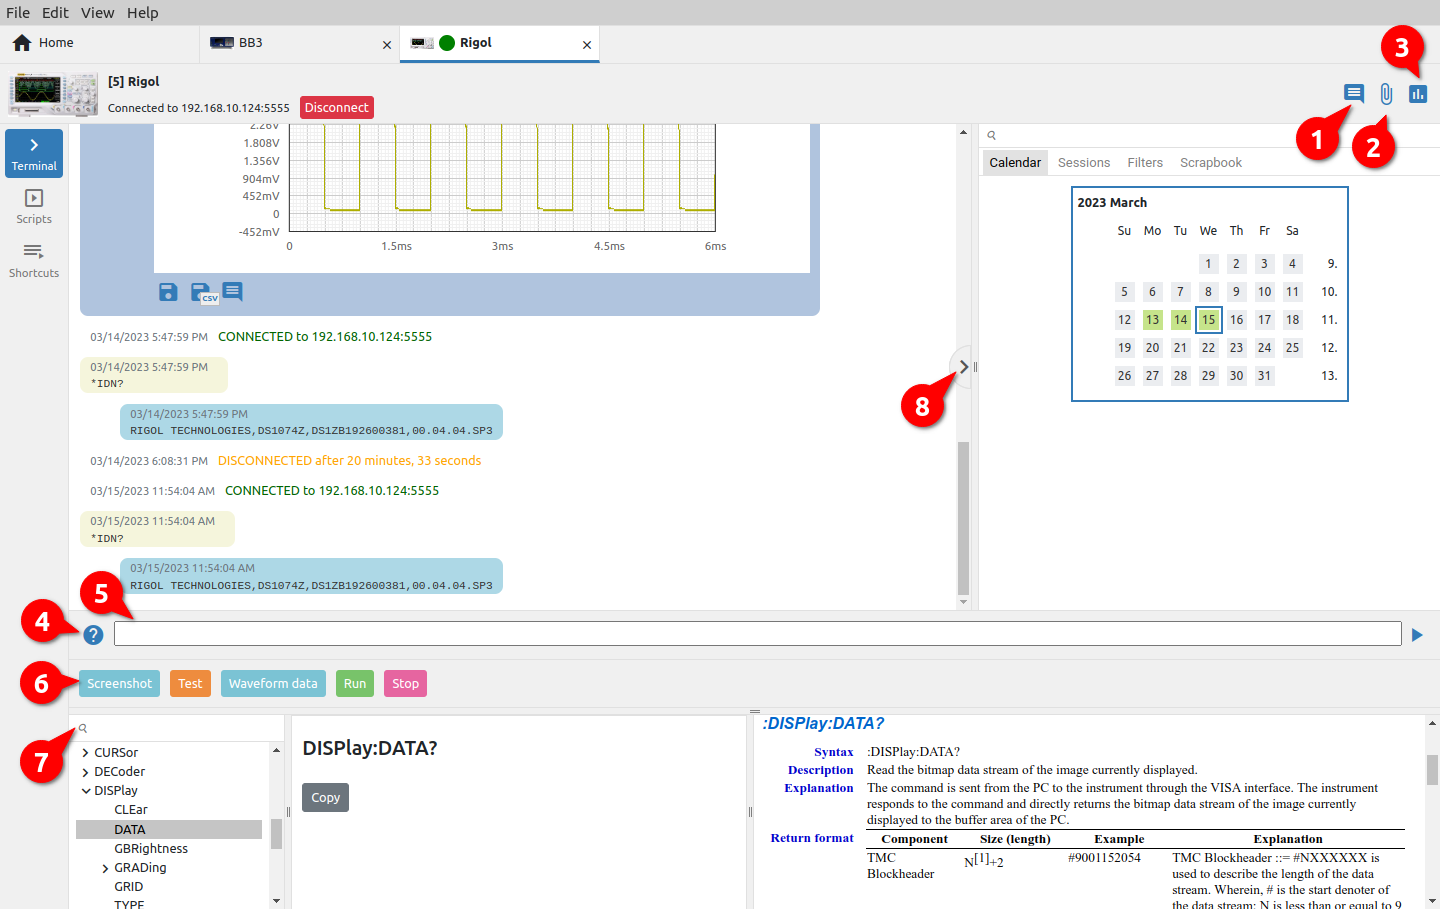
Fig. 7: Terminal section of SCPI instrument
|
# |
Option |
Description |
|
1 |
Add note |
Adds a note (see Section 6.3). |
|
2 |
Attach file |
Attaching a file (see Section 6.3). |
|
3 |
Add chart |
Creating a new chart from two or more charts (see Section 6.3). |
|
4 |
Show/hide commands catalog |
Show or hide the help section for instrument commands at the bottom of the Terminal view. Command help will only be displayed if it is defined in IEXT for the selected instrument. Help for each command contains an explanation and syntax of how the command is used with the option to copy it to the command line (5). |
|
5 |
Command line |
Prompt line for sending a command to the instrument. |
|
6 |
Shortcuts bar |
IEXT imported and user defined shortcuts. |
|
7 |
Command search |
Commands help search. |
|
8 |
Show/hide Side bar |
Show or hide sidebar with history search options. |
I2.4. Terminal (Proprietary protocol)
For instruments that do not support communication with the SCPI protocol, it is possible to use IEXT, which implements a proprietary protocol that does not have strict definitions of the format of the data to be exchanged.
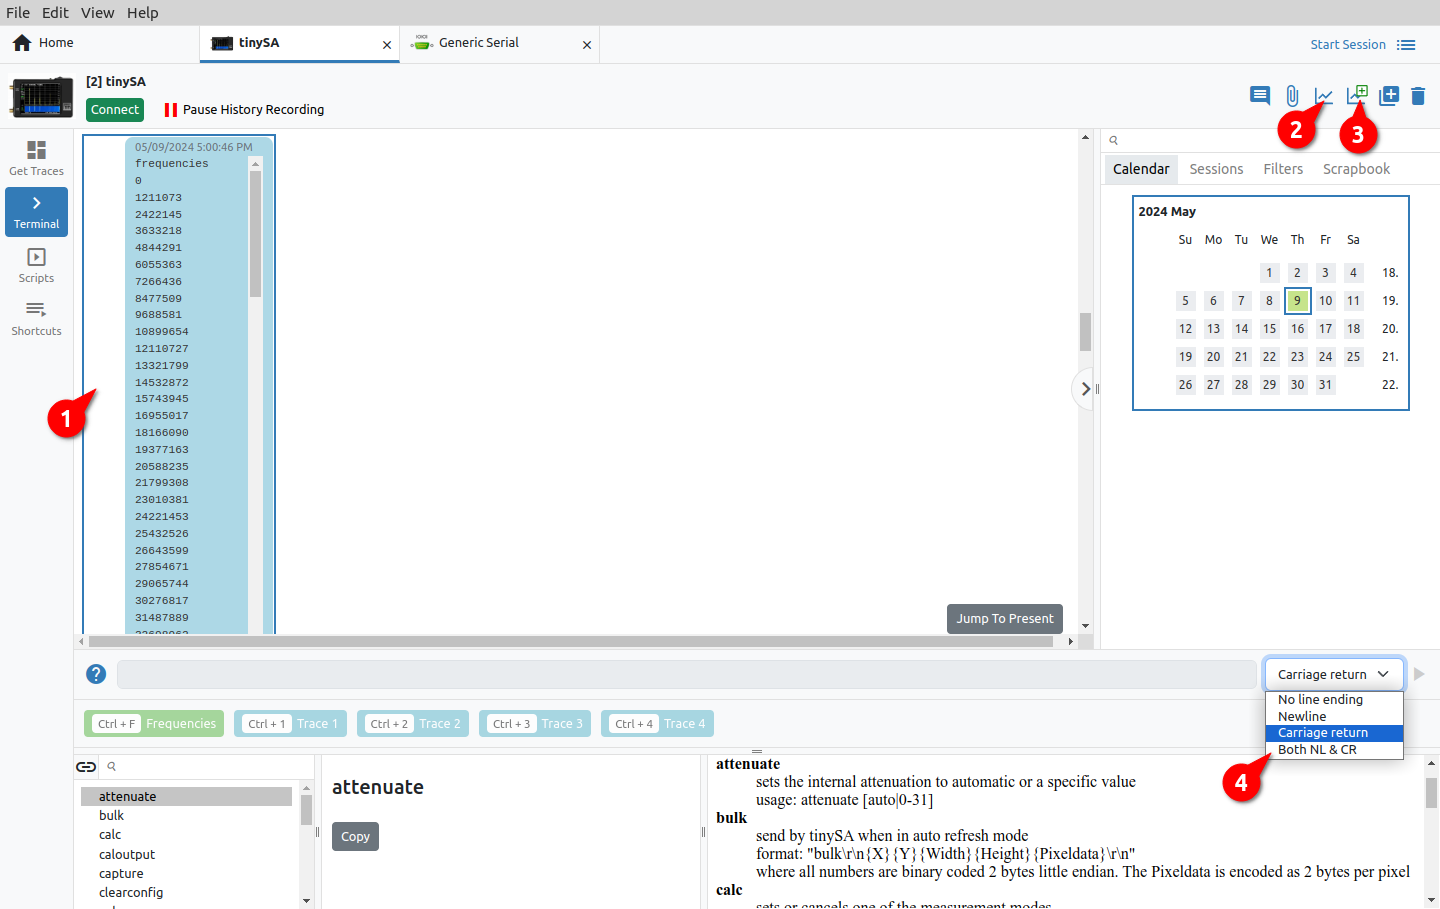
Fig. 8: Terminal section of proprietary protocol instrument
The terminal for this type of instrument (i.e. IEXT) has several additional options that are not found in the terminal for the SCPI instrument.
The terminal allows receiving a continuous stream of data that will be displayed as (1) in Fig. 8. We can subsequently convert this data into a graph using Create chart from selected items option (3).
Whether the graph will start drawing immediately as new data arrives depends on the status of the Show/Hide Plotter option (2).
If graph plotting is active and the data has not yet started arriving, a message will appear in the terminal as shown in Fig. 9.
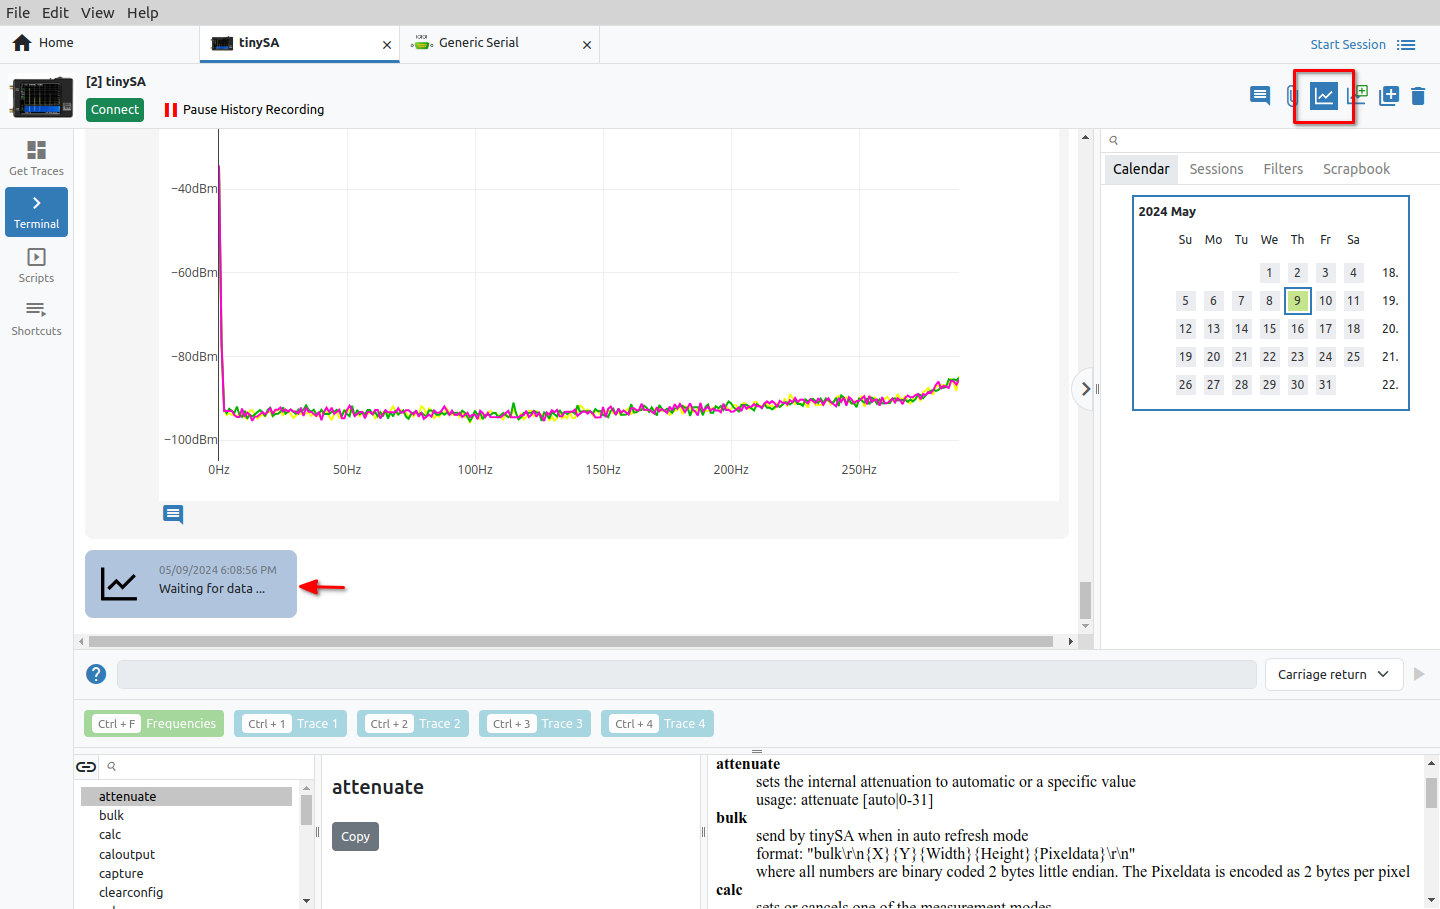
Fig. 9: Waiting for data to plot the graph
Finally, the instrument terminal with proprietary protocol offers four different end of line sequences (item 4, Fig. 8) depending on what the instrument supports.
I2.5. Scripts
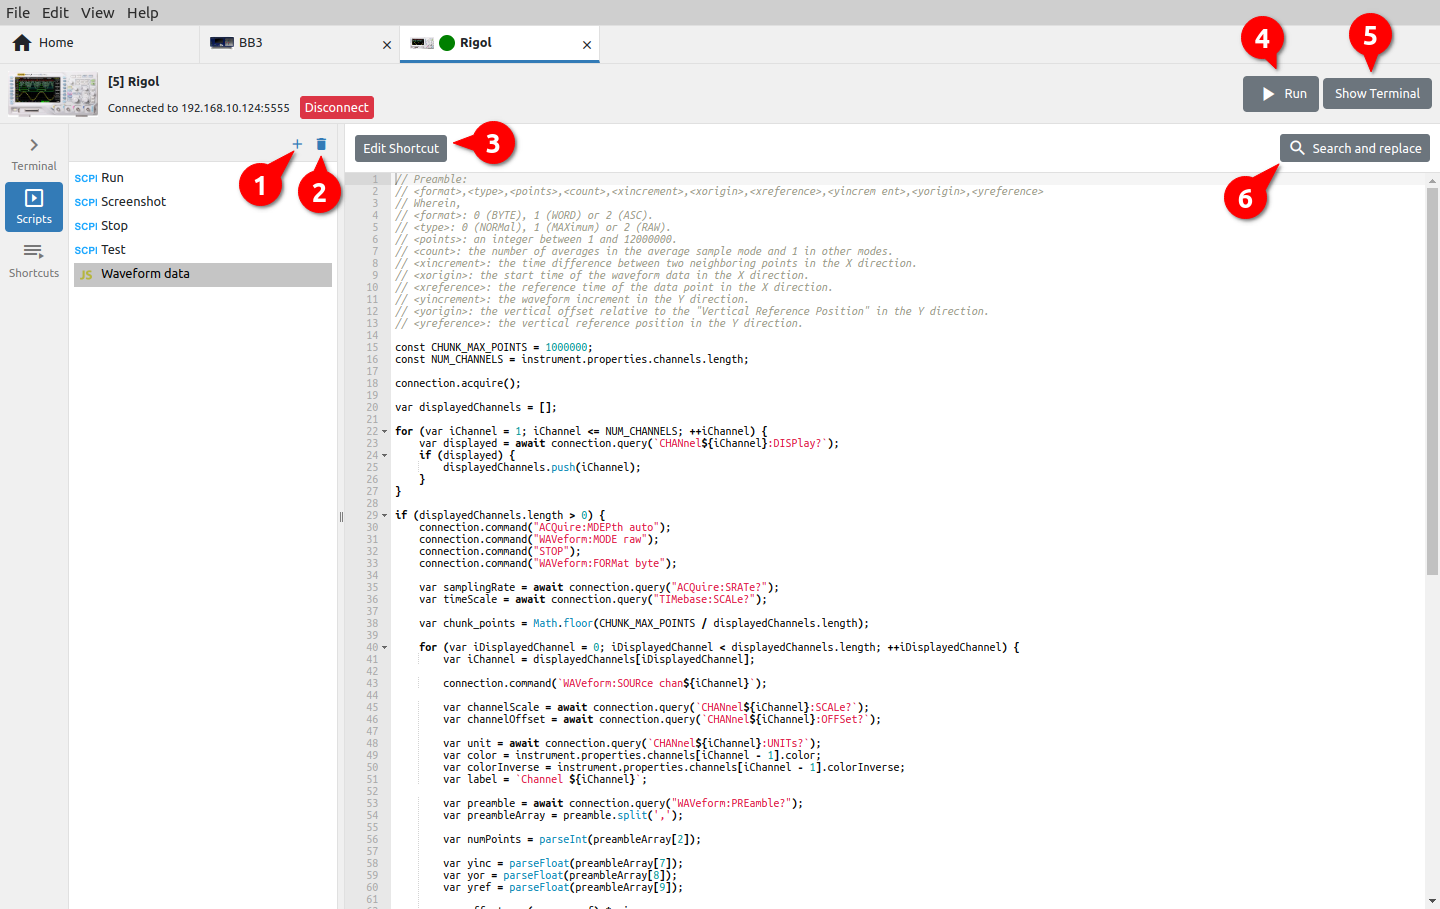
Fig. 10: Instrument scripts
Scripts can be used to automate communication with the instrument (configuration, data collection, test sequences, etc.). Three types of scripts are supported: SCPI commands, JavaScript (JS) code and MicroPython (EEZ BB3 only) script. The number of scripts is unlimited and can be defined in IEXT or created by the user. A shortcut can be added to the script for easier launch.
In addition to containing complex programming procedures, a JS script can also contain GUI elements for communication with the user (entry forms, info or error messages, etc.).
|
# |
Option |
Description |
|
1 |
Add script |
Creating a new script. It will be necessary to define the name and type: SCPI, JS or MicroPython (EEZ BB3 only). |
|
|
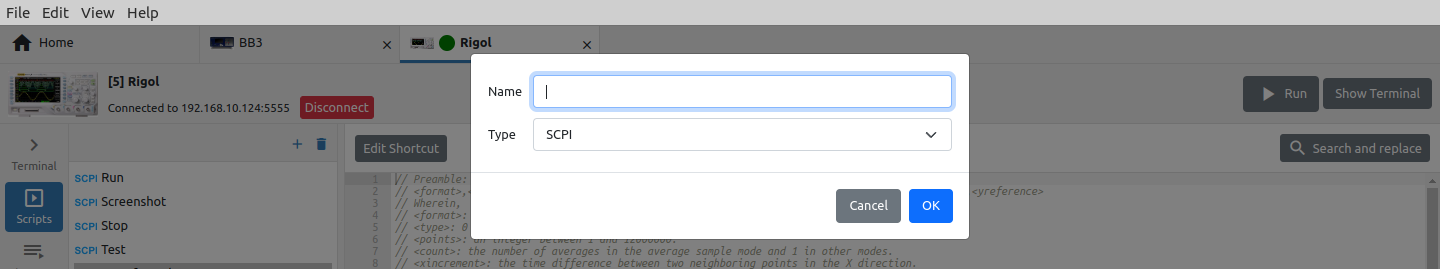 Fig. 11: Adding a new script
The content of the script is entered in the editor (Fig. 12).
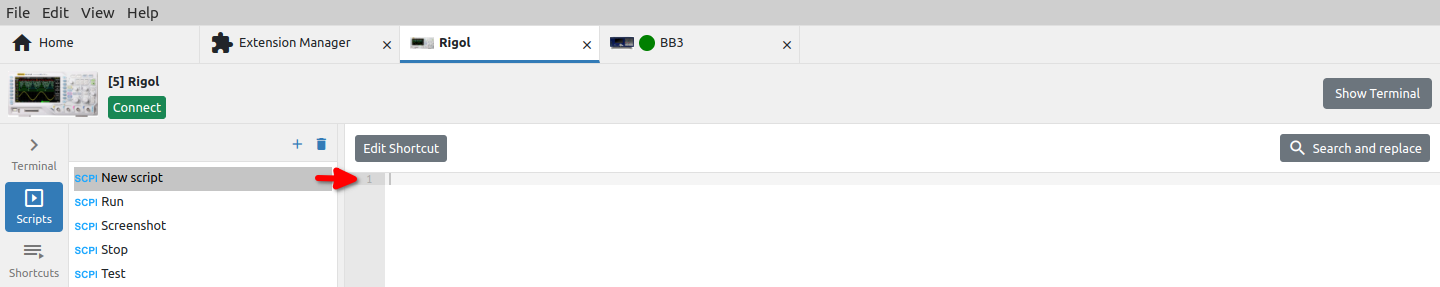 Fig. 12: Script editing
|
|
|
2 |
Delete script |
Deleting the selected script. |
|
3 |
Edit shortcut |
Editing a script shortcut (see Section 2.5.1.) |
|
4 |
Run |
Runs the script on the instrument. This option is only displayed if the connection to the instrument is established. |
|
5 |
Show / Hide terminal |
Show / hide Terminal on the right. |
|
6 |
Search and replace |
Script editor function for searching and replacing text in the script. By default, only the search field is displayed. To replace the found text, it will be necessary to click on the “+” sign. |
I2.5.1. Edit script shortcut
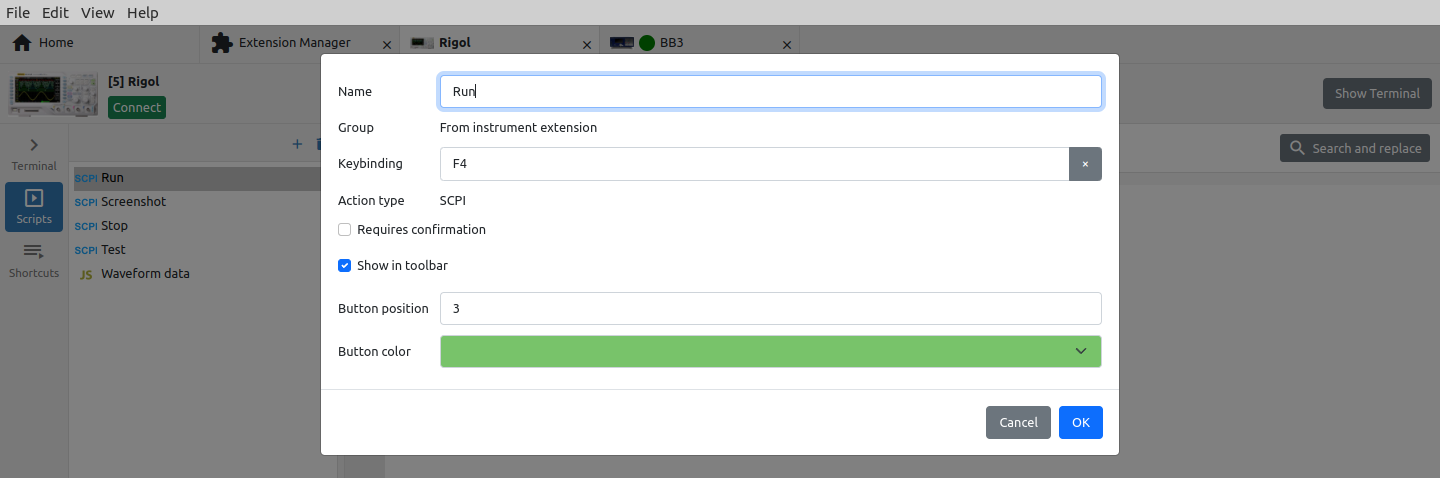
Fig. 13: Script shortcut editing
|
Option |
Description |
|
Name |
The name of the script shortcut as it will be displayed in the shortcut bar. |
|
Group |
The name of the group to which the shortcut belongs. If the shortcut is defined in IEXT, the label From instrument extension will be displayed.
|
|
Keybinding |
A key or a combination of several keys (e.g. with SHIFT, ALT, CTRL) that will start the execution of the script. |
|
Action type |
Script type: SCPI, JS or MicroPython (EEZ BB3 only). |
|
Requires confirmation |
Displays a dialog box to confirm the execution of the script. |
|
Show in Shortcuts bar |
Determines whether the shortcut button will be displayed in the Terminal‘s Shortcuts bar. |
|
Button position |
The position of the shortcut button in the Shortcuts bar. When displaying, the shortcut with a lower value will be displayed first. If there are multiple shortcuts with the same value, they will be sorted alphabetically. |
|
Button color |
Color coding of shortcut button. |
I2.6. Shortcuts
Shortcuts are used to simplify the execution of scripts and can be defined in IEXT or user defined.
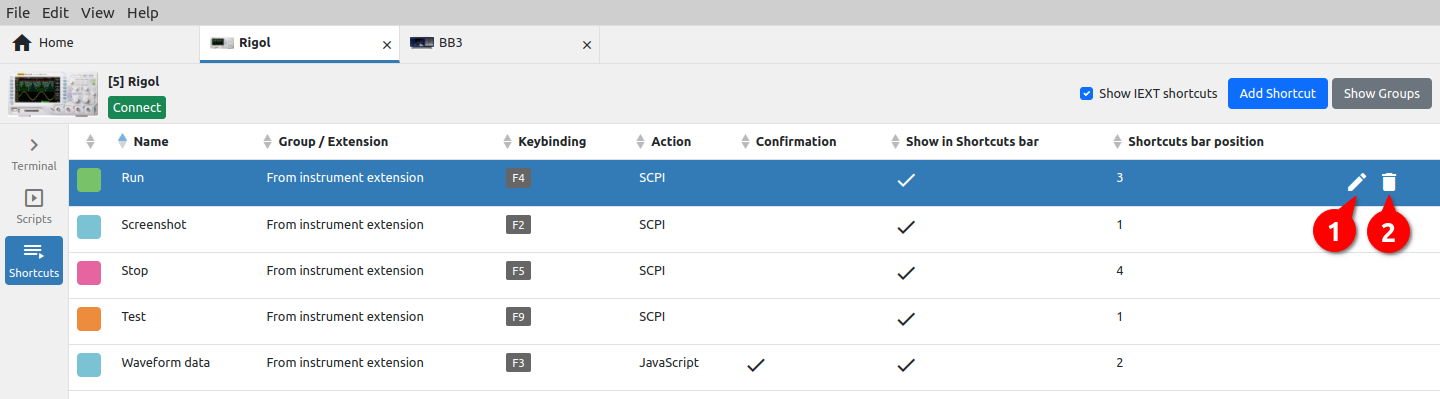
Fig. 14: Instrument shortcuts
|
# |
Option |
Description |
|
1 |
Edit shortcut |
Editing the shortcut (see Section 2.5.1.) |
|
2 |
Delete shortcut |
Deleting an existing shortcut. |
|
|
Show IEXT shortcuts |
Filters the display of Shortcuts belonging to the installed Instrument Extension (IEXT). |
|
|
Add Shortcut |
Adding a new shortcut opens the entry form as shown in Fig. 15. |
|
|
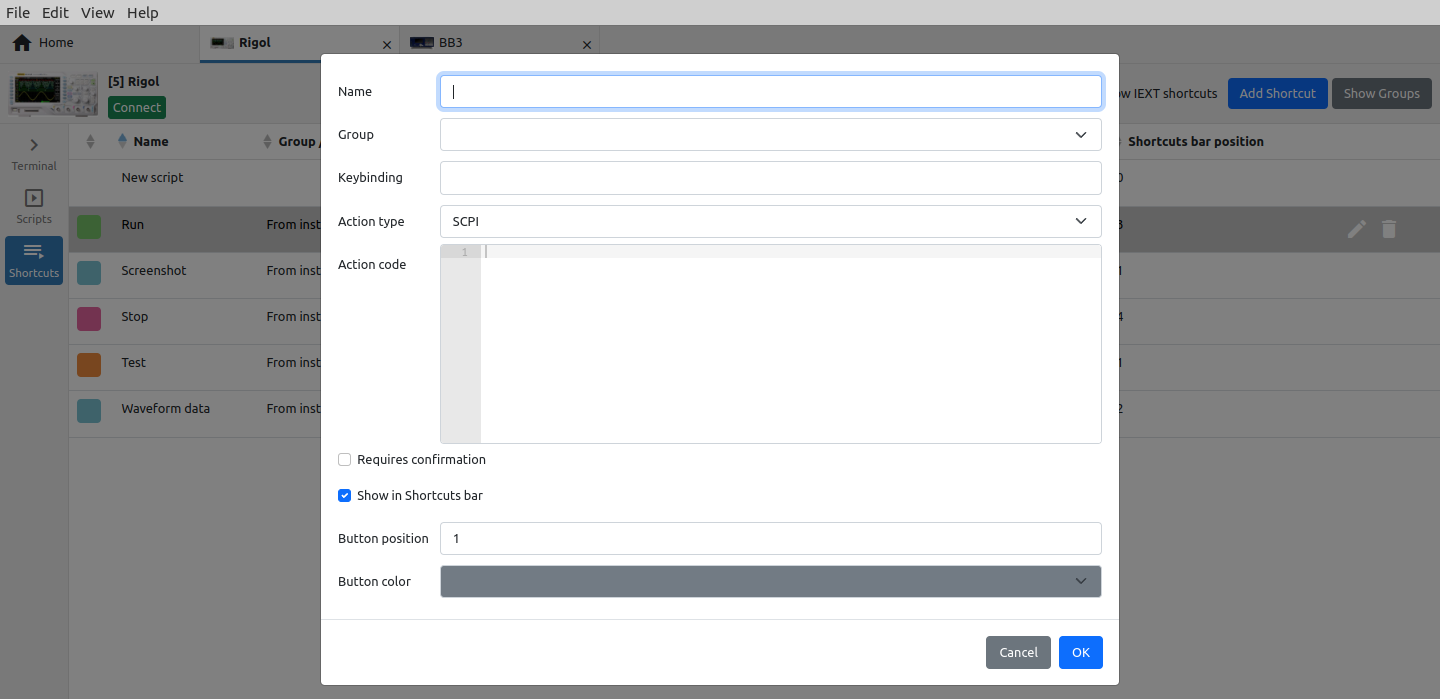 Fig. 15: Add new shortcut
|
|
|
|
Show Groups / Show Shortcuts |
Toggle between displaying a list of shortcuts and groups (Fig. 16) of shortcuts. |
|
|
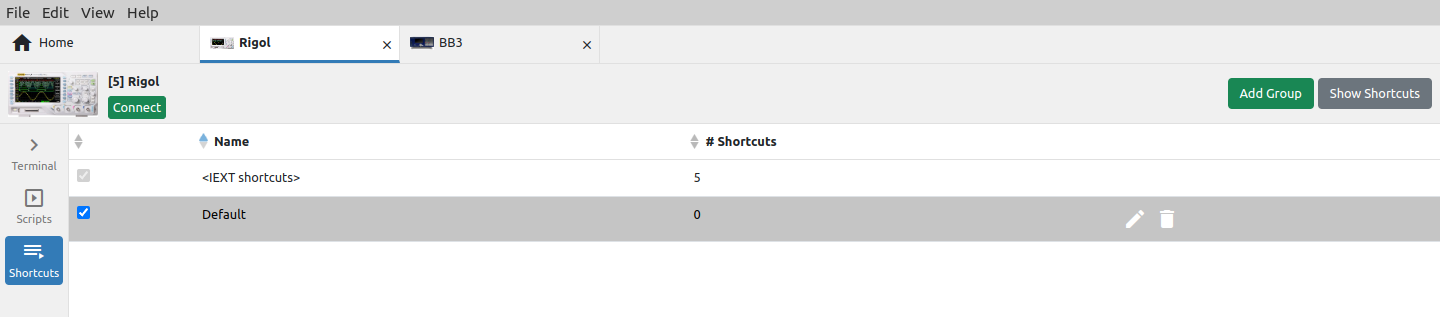 Fig. 16: Instrument shortcut groups
|
|
I2.7. Lists
Lists are used to program parameters for instruments that support SCPI list commands. Lists for programming value and duration of output voltage and current for EEZ BB3 will be described below.
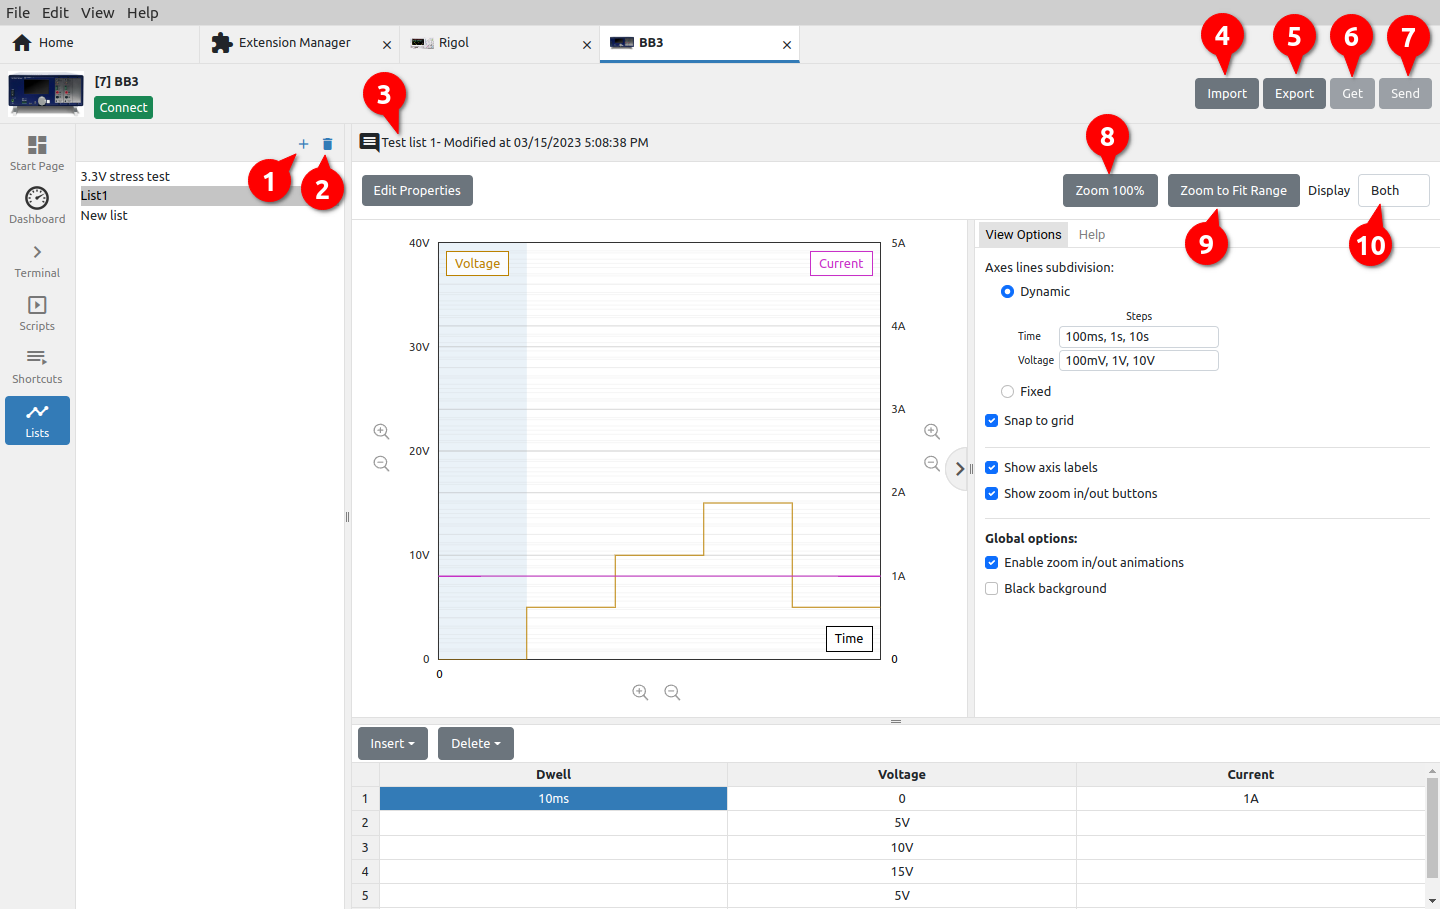
Fig. 17: Instrument programming lists
|
# |
Option |
Description |
|
1 |
Add list |
Creating a new list. The parameters of the list can be specified through a table (Fig. 17) or by defining envelope points that show the change of the parameter value over time. In addition to the list Type, it will be necessary to define a Name and optionally a Description. |
|
2 |
Remove list |
Deleting the list (use Undo from the Edit menu to restore). |
|
3 |
List info |
List description and datetime of last changes. |
|
4 |
Import |
Import list from local storage. Opens a new dialog box for selecting the folder and name. |
|
5 |
Export |
Export list to local storage. Opens a new dialog box in which a list file can be selected. |
|
6 |
Get |
Receiving a list from the instrument. The option will be disabled if connection is not established with the instrument. Opens a menu (Fig. 18) where you can choose the source (e.g. channel) from which the list will be received. For the imported list, it is necessary to enter the name and description (Fig. 19).
If the selected source does not have a defined list, an empty list will be imported. |
|
|
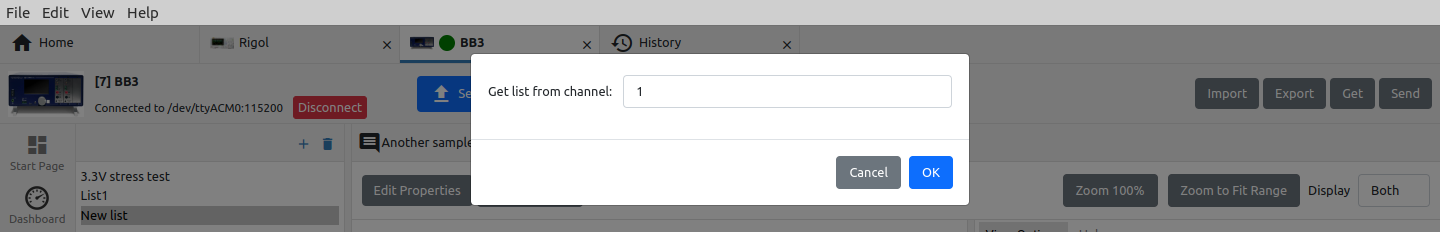 Fig. 18: List source selection
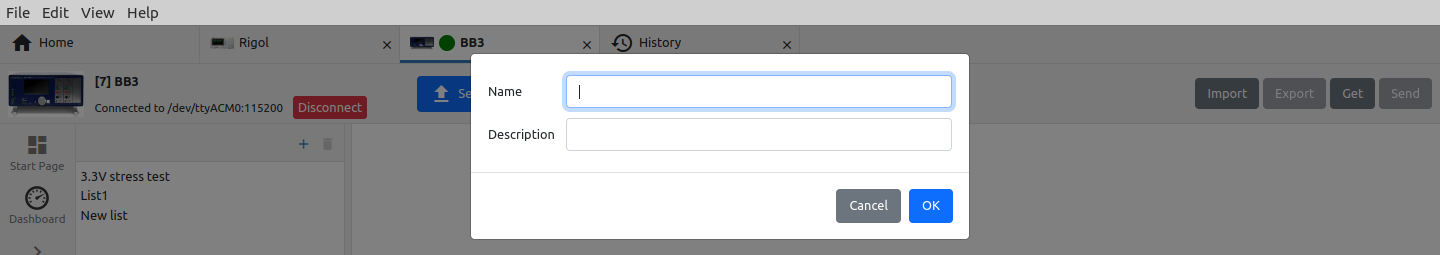 Fig. 19: Imported list parameters
|
|
|
7 |
Send |
Sending the list to the instrument. The option will be disabled if connection is not established with the instrument. |
|
8 |
Zoom 100% |
Display graph without scaling. |
|
9 |
Zoom to Fit Range |
Graph display scaled according to the largest defined value. |
|
10 |
Display |
Selection of graphs to be displayed (e.g. voltage only, current only, both). |
I2.7.1. Editing a list using a table
Editing the list via the table is shown in Fig. 17. The program parameters graph is drawn simultaneously with editing the table at the bottom of the graph. In the case shown, the list contains two program parameters: Voltage and Current, for which values should be entered as well as duration (Dwell ). To define the value, it is possible to use the units prefix, e.g. ms for dwell, mV for voltage, and mA for current.
In Fig. 20 and Fig. 21 shows all options for inserting new lines and deleting existing ones.
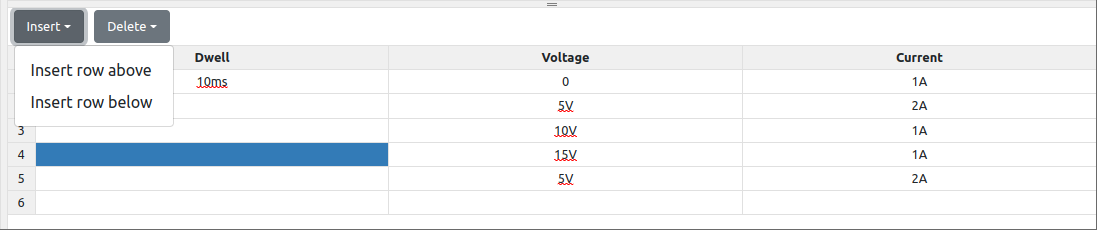
Fig. 20: Table insertion options
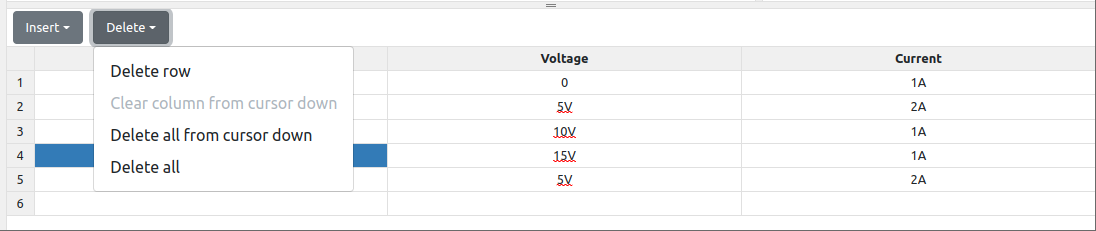
Fig. 21: Table deletion options
I2.7.2. Editing a list using an envelope
In contrast to the previously mentioned editing of the list, where it is necessary to define program points through a table, envelope mode allows program points to be defined directly on the curve of the parameter being edited. This can simplify and speed up the whole process.
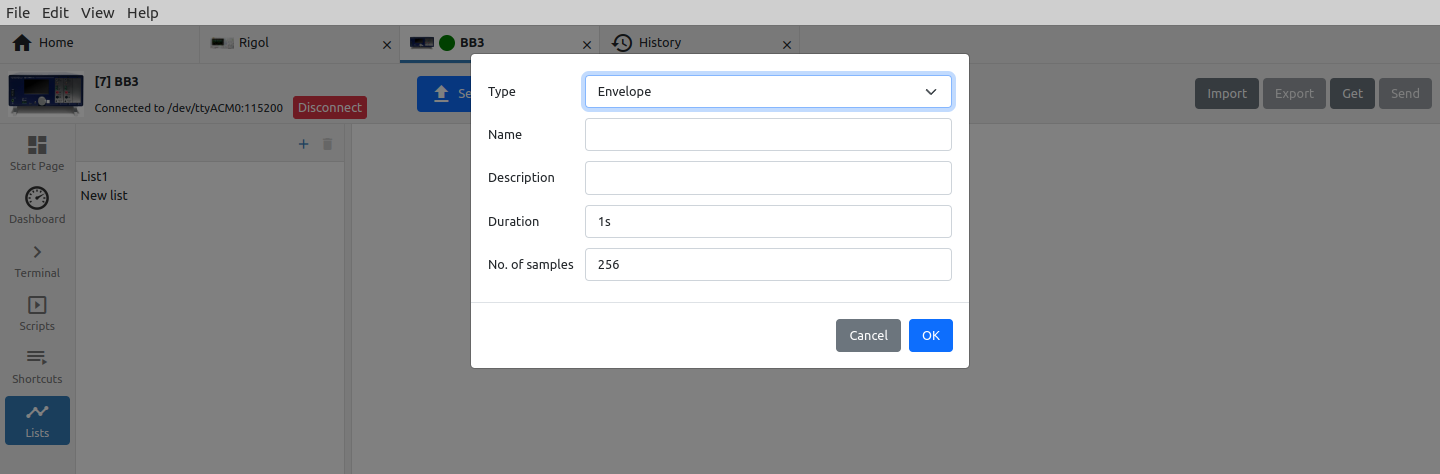
Fig. 22: Adding a new list in envelope mode
When creating a new list in envelope mode, it will be necessary to set two more parameters: the total duration of the program sequence and the number of samples (Fig. 22). The former is needed to be able to display the duration in the graph, and the later is needed to know how many points should be generated in total when sending the list to the instrument.
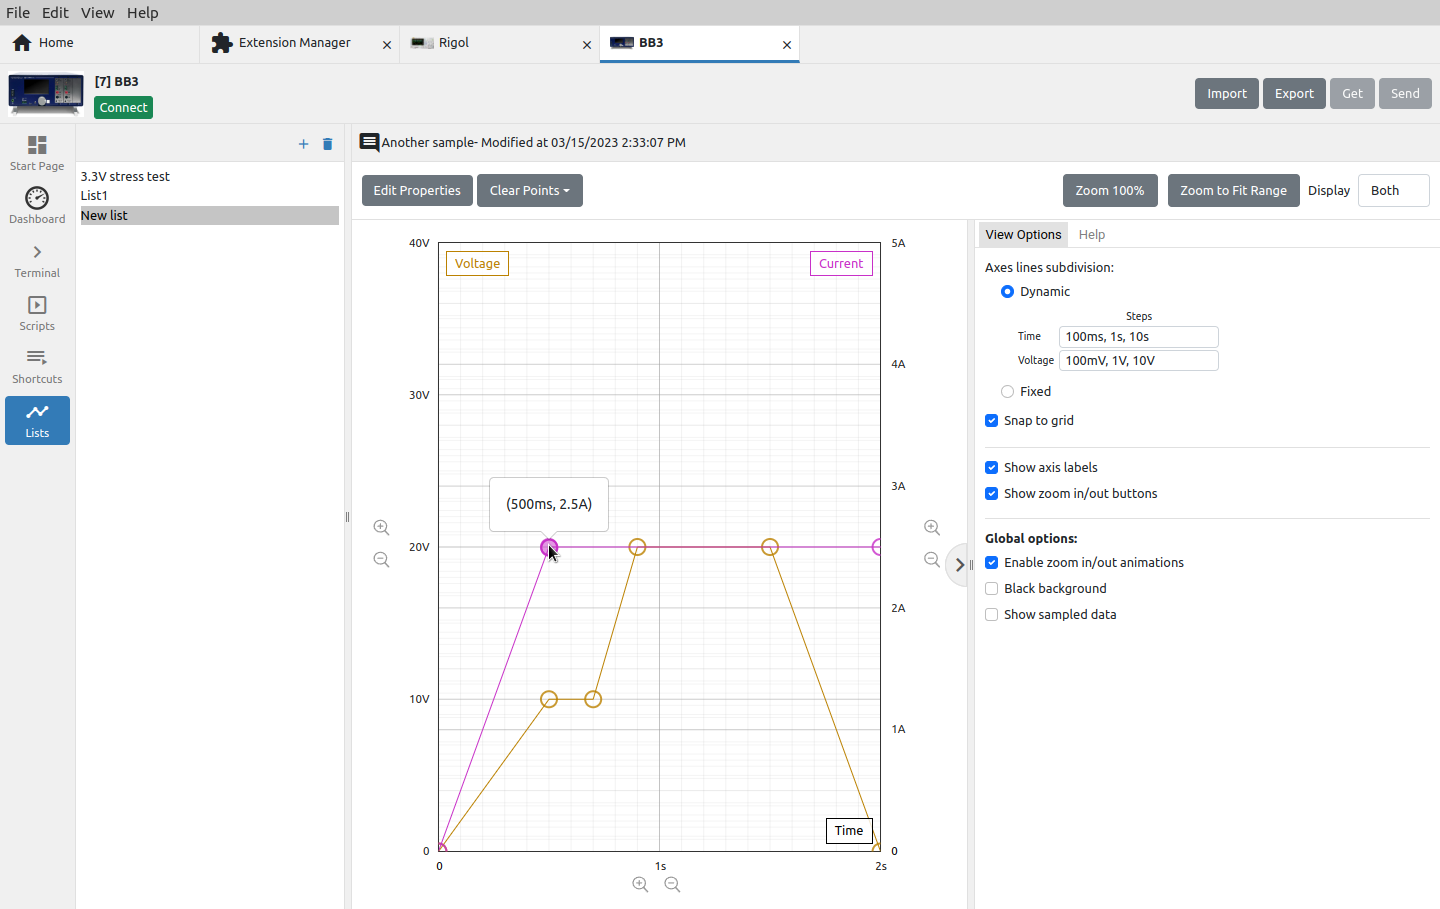
Fig. 23: Graph editing in envelope mode
The example in Fig. 23 contains 6 programming points for setting the voltage (light brown) and 3 for setting the current (magenta).
Adding a new point is simple: you only need to position the cursor somewhere in the graph and click, and a new point will appear, which will be automatically connected to two adjacent ones.
If we want to move the point in any direction, it will be necessary to position the cursor on it again and drag&drop it to a new position somewhere in the graph.
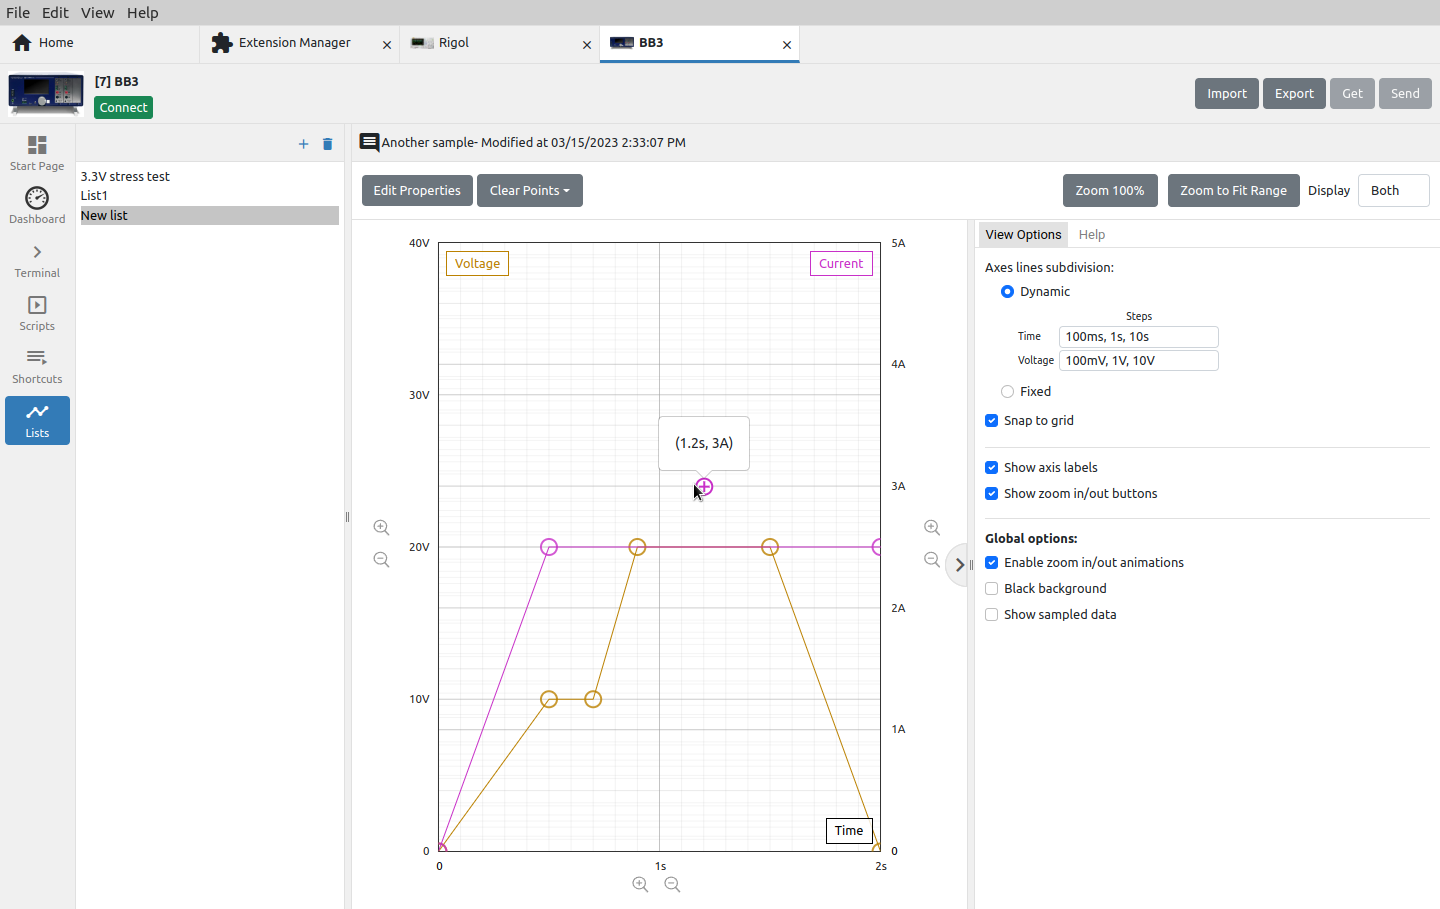
Fig. 24: Adding a new point in envelope mode
If you want to delete an existing point or manually edit its parameters after you have positioned yourself on it, you only need to click once more with the mouse when a dialog box will appear as shown in Fig. 25.
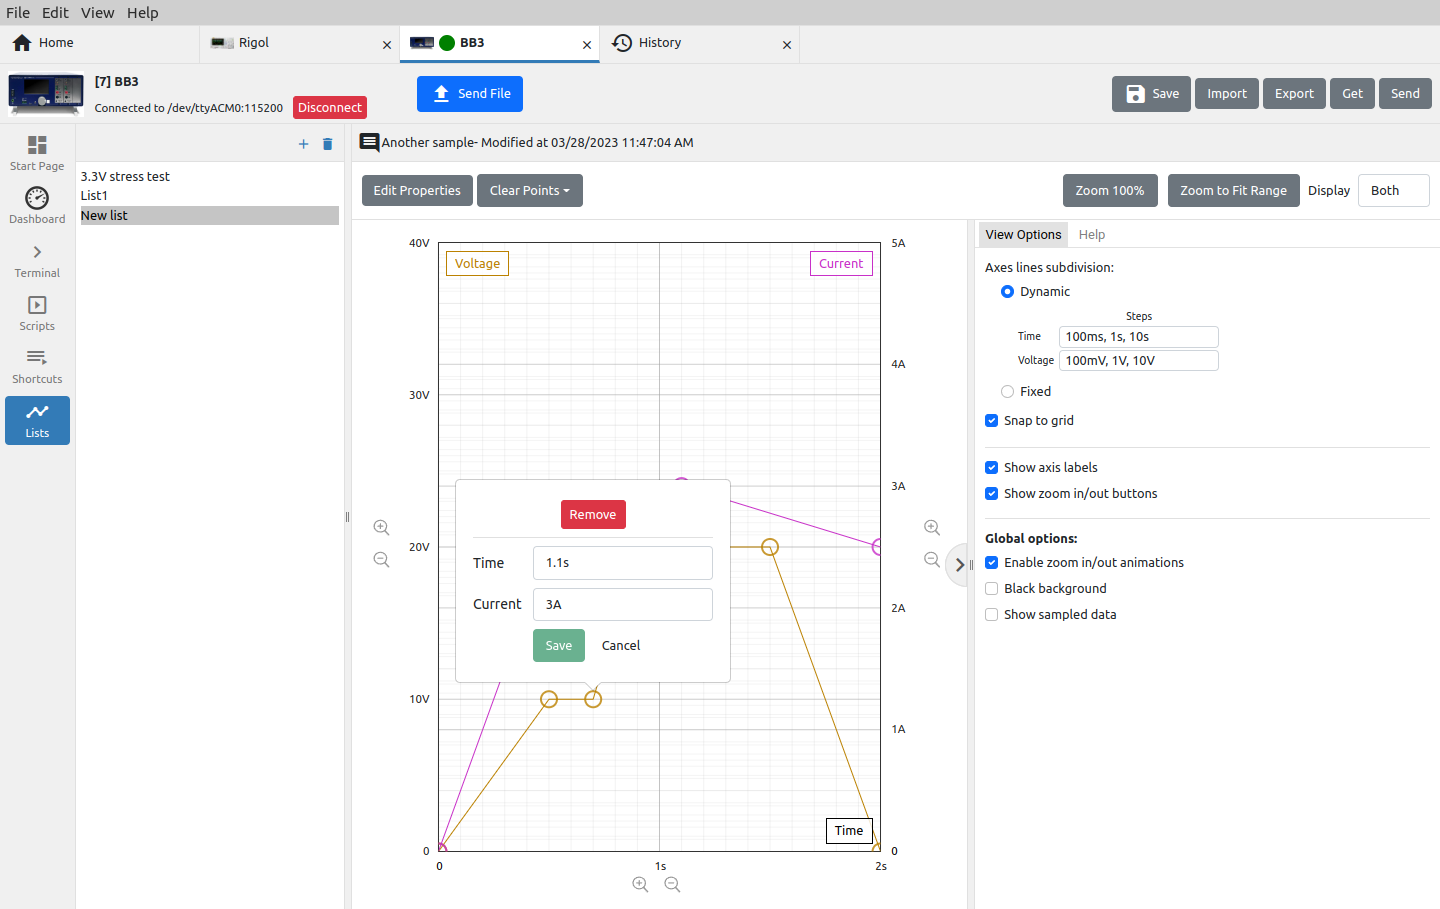
Fig. 25: Program point editing in envelope mode
I2.7.3. List view options
The display of the graph can be dynamically changed (Fig. 17)depending on the resize of the window or the number of graticules can be fixed (Fig. 26).
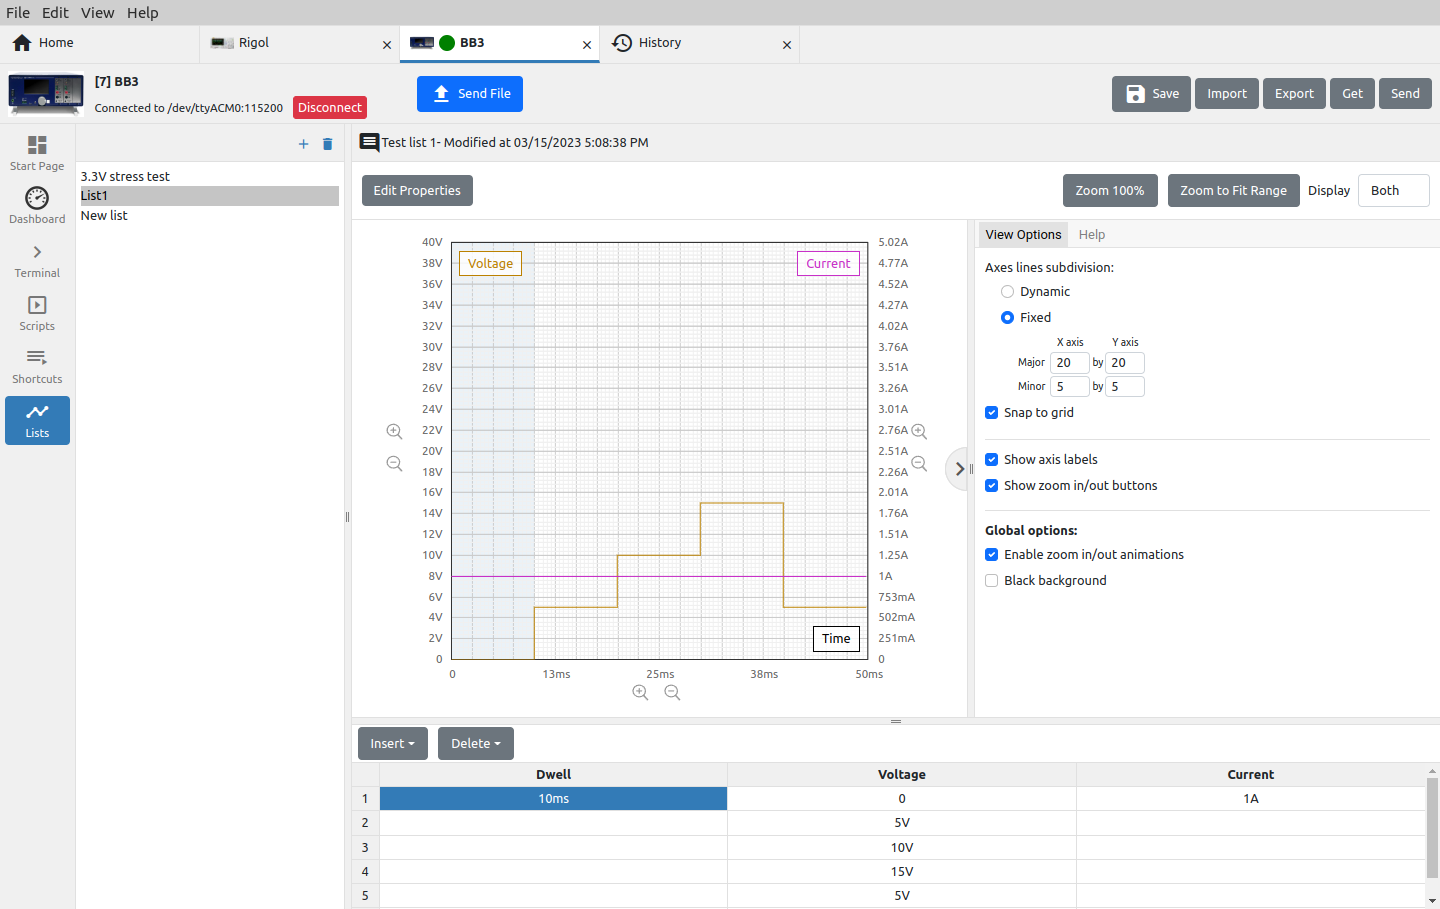
Fig. 26: Fixed graph view
I2.7.4. List help
For zooming and navigating the graph, in addition to the zoom options located next to the x- and y-axes of the graph (“+” and “-” magnifier signs), a combination of mouse keys and control keys can be used. These additional options are shown in the Help tab as in Fig. 27.
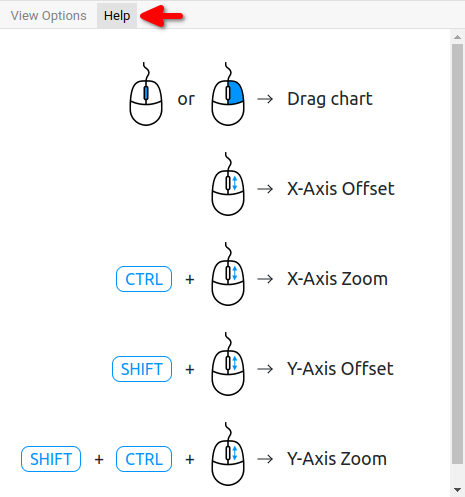
Fig. 27: Graph navigation and zoom help