14. Data logging
EEZ BB3 provides simple data logging (DLOG) of both analog and digital signals coming from installed modules. Logged data is stored on the SD card and can be viewed while the logging is in progress or upon completion or termination of logging.
Finally, it will be possible to transfer logged data to a computer using the EEZ Studio application or using similar applications using SCPI commands.
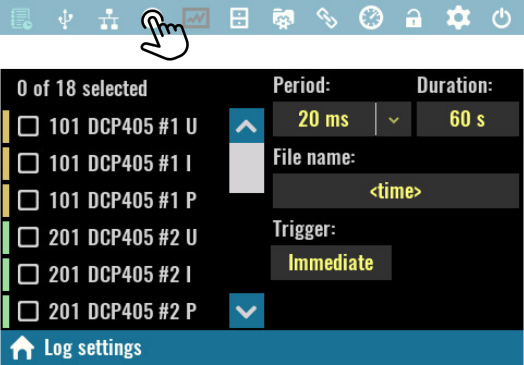
14.1. Data loggingTo start data logging, tap on the DLOG icon, when a menu will open with the following options:
Scrollable list of all available measurement targets, e.g. voltage, current and power for each power channels (DCP and DCM modules), SMX and MIO modules analog outputs, MIO modules digital outputs, etc.
|
|
|
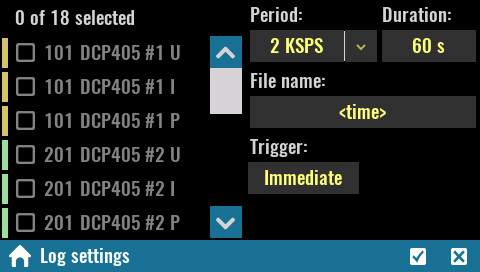
Period: Specifies the sampling rate of data logging, i.e. the time between two measurements to be recorded. For example, if the period is 20 ms, this means that measurements will be taken 50 times per second.
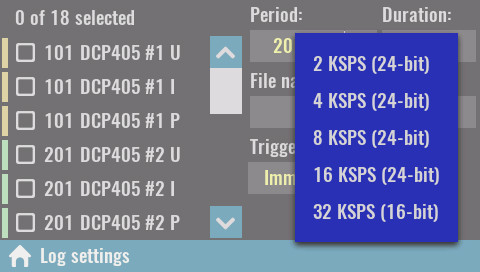
When the MIO module is installed, a list for selecting sampling rates supported by the installed AFE will also appear.
|
|
|
If one of the MIO sampling rates is selected, it will disable the resources of all power modules because they do not support such speeds. |
|
|
Duration: Max. duration of data logging. If you want continuous data logging, enter infinity (∞) from keypad. Logging can be interrupted at any time with a new tap on the DLOG icon when its color has changed to red. Once interrupted data logging cannot be resumed.
File name: The name of the file where the logged data will be stored. The file with the name entered will be created on the SD card in the Recordings folder. If the file name is not entered, the current time and date will be used in the following format: yyyy_mm_dd-hh_mm_ss.dlog.
|
|
|
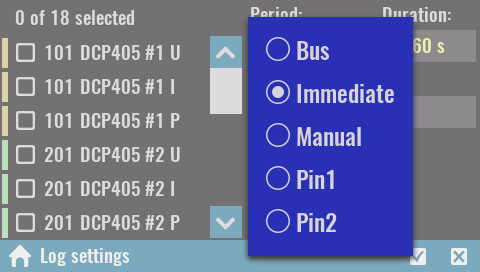
Trigger: Data logging can be initiated by various trigger events. See General trigger settings for more information. |
|
|
|
|
|
The Start option triggers data logging when the color of the DLOG icon will change to red. From the DLOG viewer, you can return to the main page, and the color of the resources given to the log will be changed for a better indication.
Data logging can be interrupted at any time, and cannot last longer than the Duration set. If duration infinity (∞) is selected, logging will continue while EEZ BB3 is active and will be limited by free space available on the SD card.
|
|
|
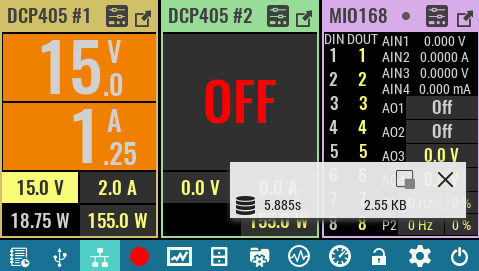
During data logging, a floating (“overlay”) menu will appear that will be able to move anywhere on the screen, minimize or close. It’s displaying the elapsed time and data size.
|
|
14.2. Displaying recorded data
|
DLOG viewer lets you view recorded data while data logging is in progress. In this case, the recorded data will be displayed at the rate at which it was sampled (i.e. if the period is set at half a second, then new data will also appear every half a second).
The status bar will show information about the elapsed time and data size, as well as a DLOG icon that can terminate logging early.
To return to the main page, use the Home icon. |
|
|
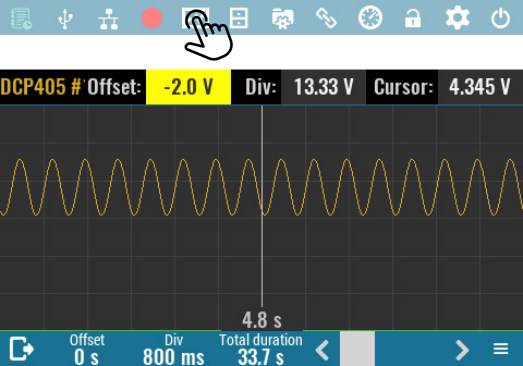
When logging is completed or terminated early, the DLOG viewer will open automatically. It will now be possible to scroll through the recorded data using the following controls:
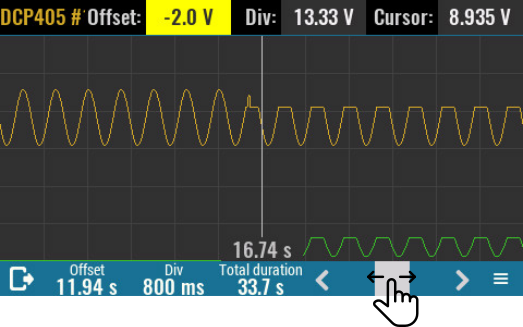
Time offset Position on timeline from start of measurement. Moving along the timeline is possible by directly entering a new value with a numeric keypad, using an encoder knob, or using a scroll bar on the right side of the status bar.
|
|
|
Time div Logging data display area has 12 x 6 cells graticule that helps to determine time duration and measured amplitude more easily. This parameter defines the duration of one time division. The minimum duration is 800 ms and is determined by screen resolution and displaying principle (i.e. minimum one pixel per sample).
Total duration Displays the total duration of logged data in seconds. |
|
|
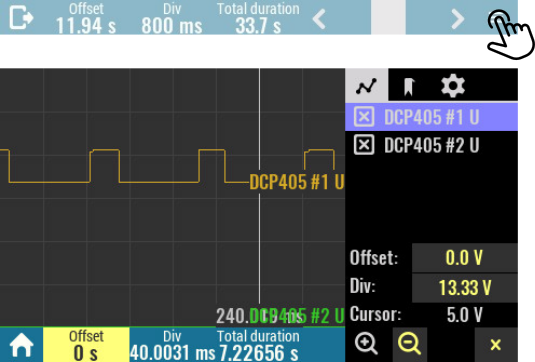
The DLOG viewer has in its right down corner an icon that provides access to a multi-tab section.
The Graph section displays a list of all logged resources, by default all are selected as visible.
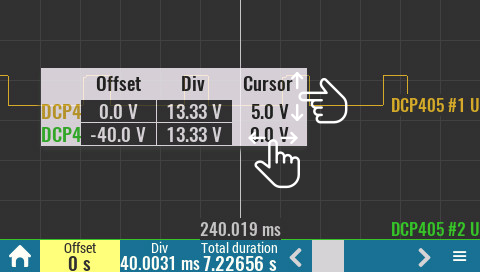
Offset: Change the Y-axis offset of the currently selected graph.
Div: Change the Y-axis division of the currently selected graph.
Cursor: Displays value of on the cursor position of the selected graph. |
|
|
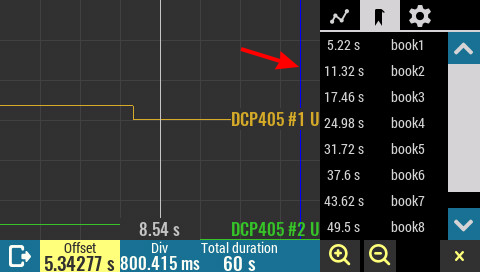
The Bookmark section contains a list of the positions and names of all bookmarks added during datalogging. Bookmarks can currently only be added using the SCPI command. Bookmarks are shown in the graph with vertical blue lines.
SCPI SENSe:DLOG:TRACe:BOOKmark <bookmark> |
|
|
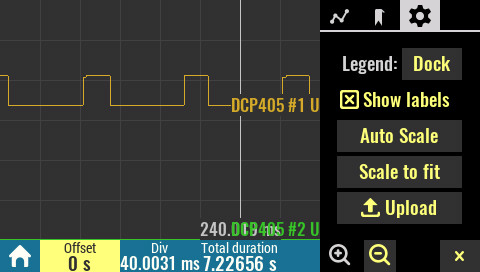
The Settings section contains general graph settings as well as an option to transfer the DLOG file to a PC.
Legend: Specifies whether or not the legend of the displayed DLOG graph is displayed. If the legend is selected to be visible it will be necessary to close the DLOG settings first.
|
|
|
Show labels Displays units on the right end of the trace.
Auto Scale Reset Offset and Div values for the all traces to initial values.
Scale to fit Maximize the view of all data traces. |
|
Upload
Transfer logged data to the EEZ Studio. This option is available only if active connection exists (via USB or Ethernet).
Zoom in / Zoom out
Changes the time division (X-axis) in increments of 2x
Close
Close this menu.
|
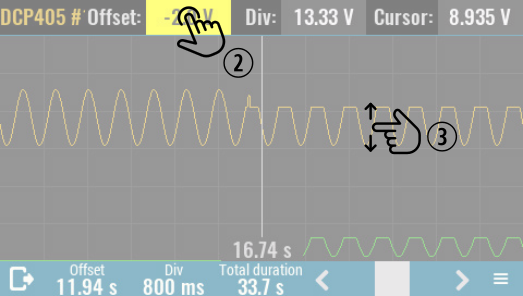
When opening the DLOG viewer will sort all recorded traces one above the other for better visibility. However, this order can be changed as desired by changing the Offset parameter of each displayed trace. Trace y-axis offset can be changed in the following way:
|
||
|
1 |
Tap on the desired trace Offset cell on the Legend menu. |
|
|
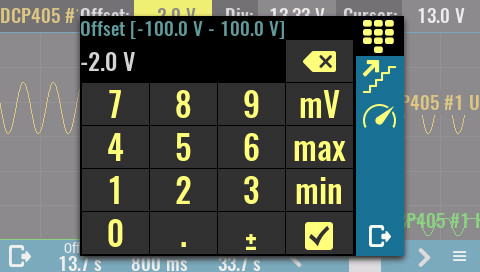
2 |
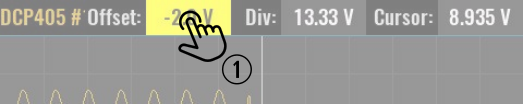
Tap once again if you’d like to enter exact value of the new offset. The numeric keypad will appear and any value within displayed range can be entered (e.g. -100 to 100 V as shown below).
Offset value define trace position in reference to the middle of the viewing area that represents 0 V. |
|
|
|
|
|
|
3 |
The trace offset can be also changed by simply tap on trace and move it new position. While moving displayed Offset value will change accordingly. |
|
Trace amplitude can be changed in the similar way by changing its Div value in the Legend menu.
14.3. Logged data transfer to a computer
|
1 |
Start EEZ Studio or, if not already installed, follow the installation steps as described in Using EEZ Studio to upgrade peripheral module firmware section. |
|
2 |
Data log files are stored into Recordings folder on the SD card. To access that folder switch to the terminal tab by selecting the icon of the same name on the left and enter MMEM:CDIR "/Recordings". The MMEM:CAT? query returns all data log filenames.
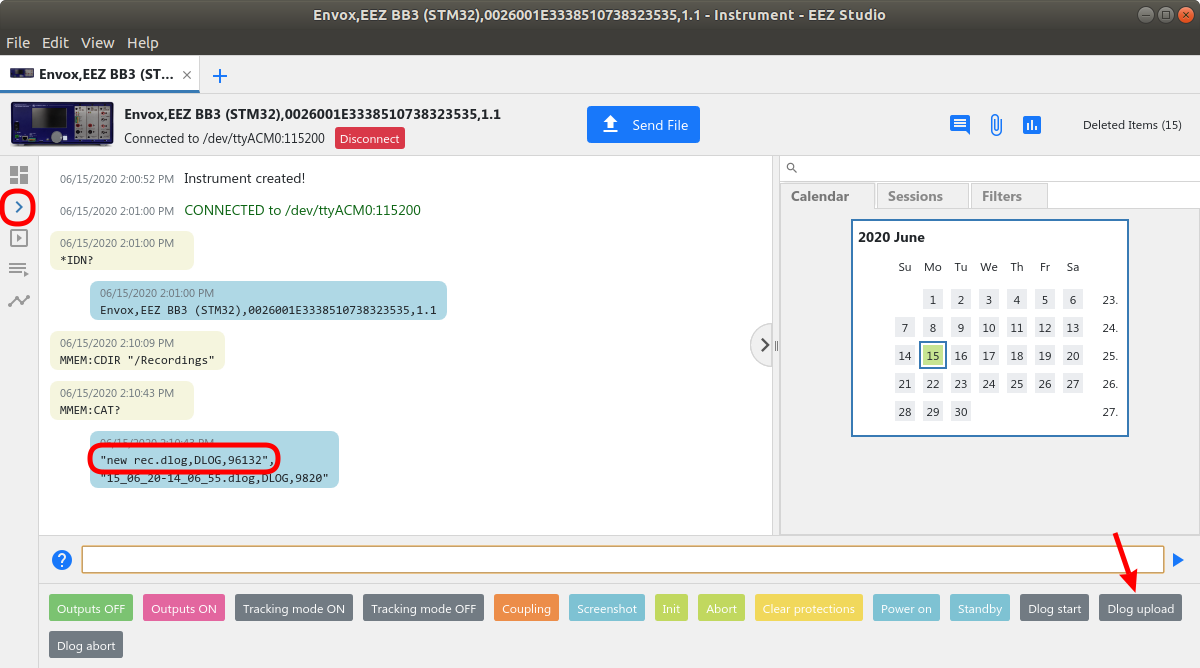
Select Dlog upload javascript from the list of the shortcuts. |
|
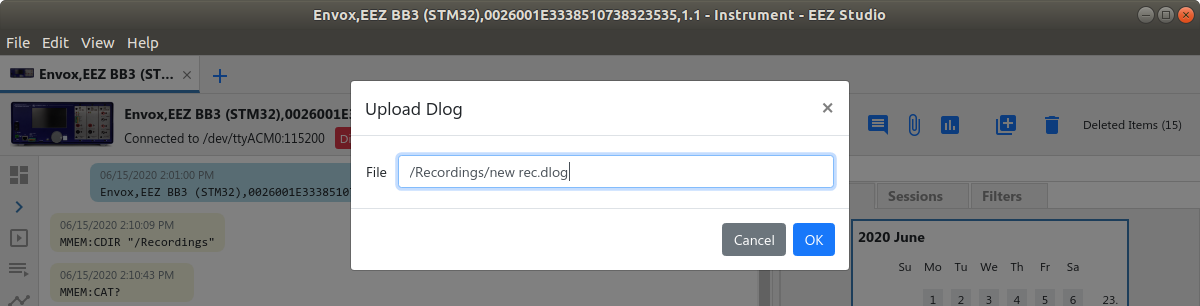
3 |
Enter the data log file name:
|
|
4 |
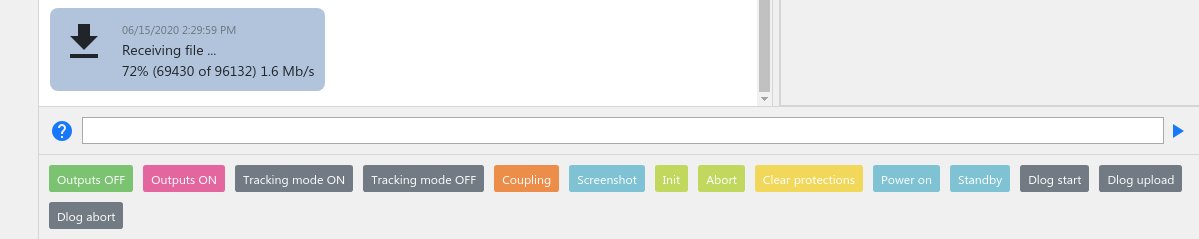
An upload progress bar will be displayed.
|
|
5 |
Data log will appear as new item in the SCPI session view. You can open it for further analysis with double click.
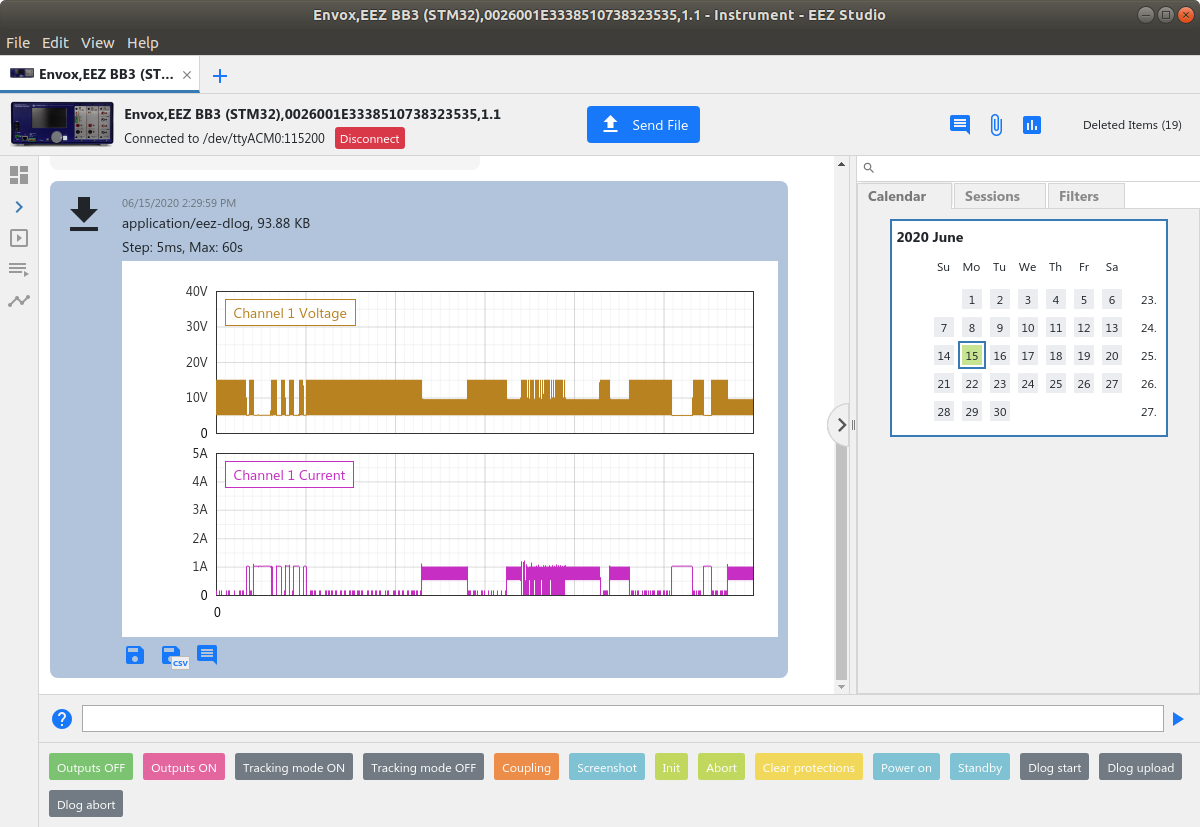
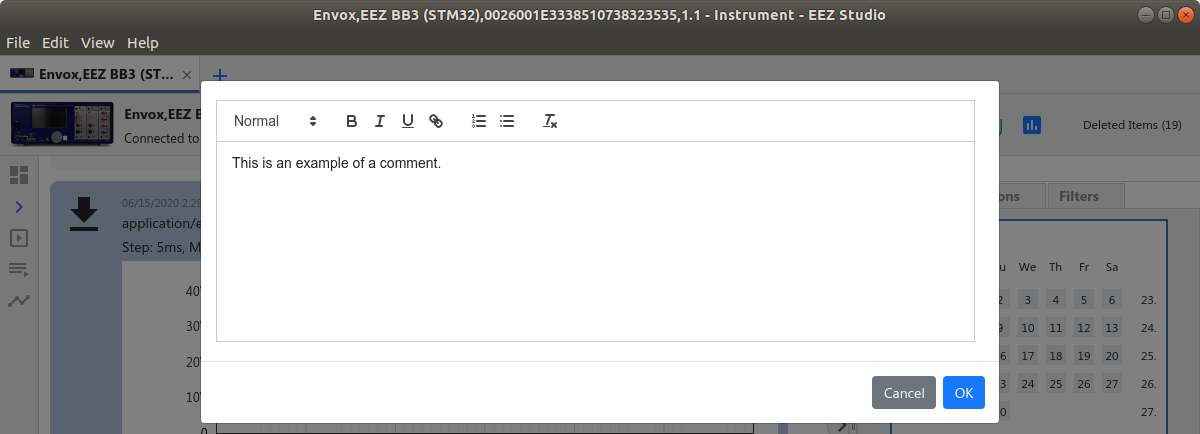
An arbitrary comment can be added by selecting the Comment icon when new entry form will appear:
|
|
|
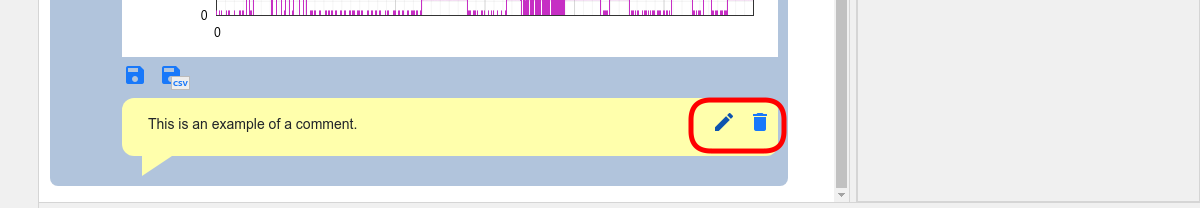
Once added, comment can be modified or deleted by hover mouse on comment area when two new icons will appear:
|
14.4. Initiate data log transfer on the EEZ BB3
Transferring the data log to the EEZ Studio can be initiated on the EEZ BB3, too. Before initiating the transfer, make sure that the connection with the EEZ Studio is established as described in steps 1 to 4 in previous section.
|
1 |
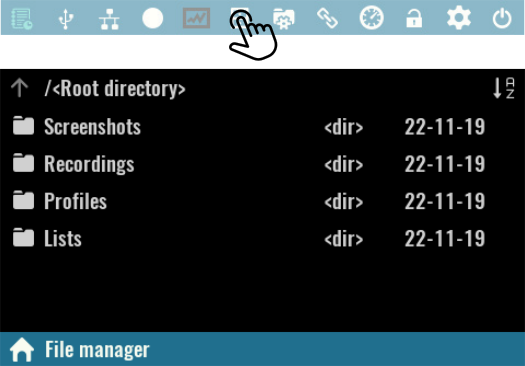
Open the File Manager and move to Recordings folder. |
|
|
2 |
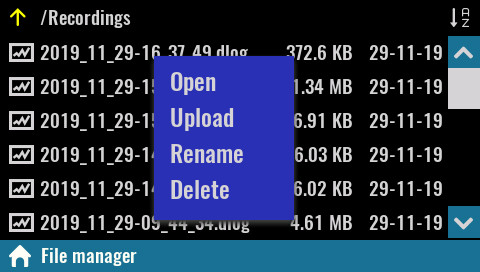
Click on desired data log file and select Upload option from the menu. |
|
|
3 |
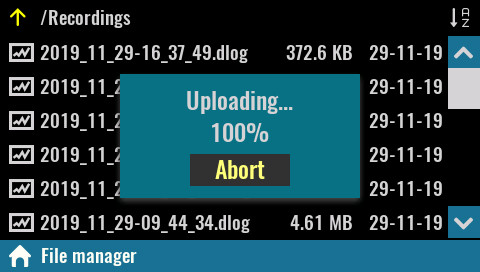
Wait until the data transfer is complete. |
|
14.5. Establishing serial (via USB) communication with a Linux computer
EEZ Studio users on a Linux computer may receive a series of error messages every time they successfully connect to EEZ BB3 via the serial interface. The reason for this is the existence of a Modem manager application that will send a series of modem commands to the connected device (EEZ BB3 in this case). The EEZ BB3 has ability to interpret only SCPI commands and therefore on each modem command it will response with an error message.
If the Modem Manager application is not needed (i.e. there is not other serial devices connected on the computer) it can be simply deinstalled with the following command from the Terminal application:
sudo apt-get remove modemmanager
However, if you want to keep the Modem Manager, it can be configured to avoid sending unnecessary modem commands to the connected EEZ BB3 in the following way:
|
1 |
Start Terminal application and enter the following command to determine which filter policy Modem Manager is using on your system by viewing its status: sudo systemctl status ModemManager
● ModemManager.service – Modem Manager Loaded: loaded (/lib/systemd/system/ModemManager.service… Active: active (running) since … … CGroup: /system.slice/ModemManager.service └─644 /usr/sbin/ModemManager –filter-policy=strict
|
|
2 |
Modem Manager filter policy has to be changed from strict to default. Use your favorite text editor like gedit to make that modification: sudo gedit /lib/systemd/system/ModemManager.service
Additionally you can add under [Service] section the following line: Environment="MM_FILTER_RULE_TTY_ACM_INTERFACE=0"
|
|
3 |
After changing the service file, reload the systemctl configuration and restart Modem Manager: sudo systemctl daemon-reload sudo systemctl restart ModemManager
Optionally you can check once again the Modem Manager filter policy that should be like this:
● ModemManager.service – Modem Manager Loaded: loaded (/lib/systemd/system/ModemManager.service… Active: active (running) since … … CGroup: /system.slice/ModemManager.service └─1010 /usr/sbin/ModemManager –filter-policy=default
|